Diagnosing Connection Issues
Tips for resolving connection issues and using the network diagnostic tool
Before You Start
Glassix uses a number of domains which must all be accessible from your network for proper functionality. If you haven't already, please review our Network Diagnostic Tool and ensure that your organization has already implemented the proper network security configuration to provide for uninterrupted access to all domains on the list.
Even if you believe you have full access to all these domains, it is recommended that you forward the full list to your IT team. Often, they will have a better picture of the full range of network security running on your computer, and may be able to identify issues that you cannot.
Note:In almost every case, connection-related issues will have to be resolved by you and your IT team. Glassix does not have access to your network configuration and cannot make changes for you.
Overview
Because Glassix is an always-online and live-updating service, interruptions in your connection to Glassix can be the cause of a number of issues, including:
- Agents unable to connect to Glassix
- No new tickets appearing in the queue
- Messages in a conversation not showing up for all agents
- Agents getting kicked out of Glassix irregularly
- Agent status changes not visible to all agents
- Drafts and fields not saving properly when navigating between tickets
Everything you do in Glassix has to be communicated back to the Glassix servers, which is why a consistent and reliable connection is so important. If anything is preventing you from making or maintaining a stable connection with Glassix, you're likely to run into any or all of the issues above.
Network Diagnostic Tool
If you're experiencing any of the above issues, there are a few steps you can take to help you and your IT team figure out where the problem is. The first step we recommend you take is to run our Network Diagnostic Tool. This tool will test your computer's connection to each service Glassix uses and let you know if you're able to connect to each one:
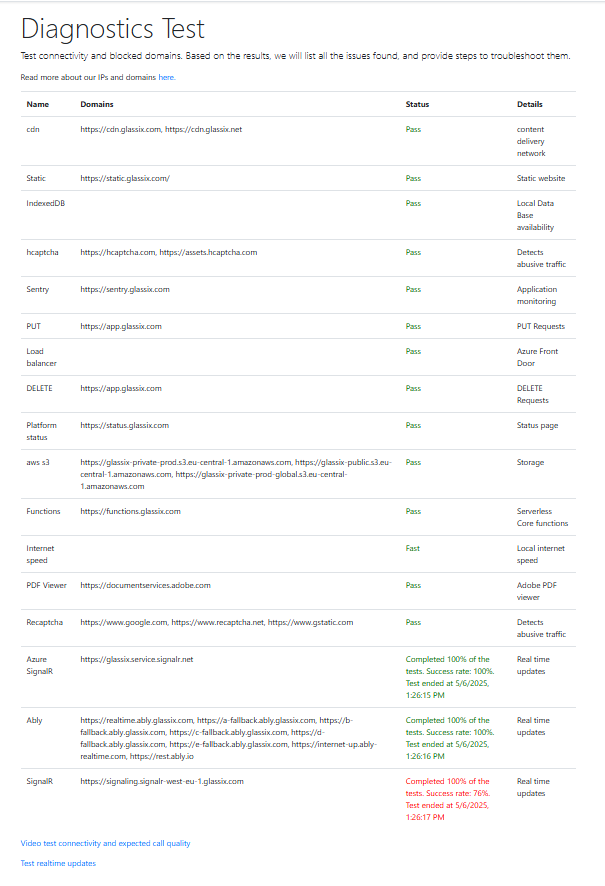
If there are any services which do not return a green result, these are likely to be the cause of, or related to, your connection issue.
Note:Red results in the SignalR, Ably and Azure SignalR tests indicate potential issues with live updating of Glassix. If you are unable to login or if the site is not accessible at all, these results are not related to your issue.
If you are unable to connect to any of our services, please reach out to your IT team and ask them to investigate the issue. The most likely reason for connection issues found in these tests is a misconfiguration in your device or network security policy.
Network Diagnostic Tool Parameters
Note:The extended network diagnostic options should only be used if there is a problem with the live updating of Glassix that takes time to surface. If you are having an immediate issue, for example if you are unable to access the login page, this diagnostic is not relevant to you.
If you receive only green results from the Network Diagnostic Tool, but you are still having connection issues, we have a more in-depth diagnostic that may help your team get more accurate information about the problem.
The in-depth diagnostic can be accessed at the following link: https://app.glassix.com/diagnostics-test?timesToCallServer=7200&arrayBatchSize=10&delayBetweenRequestsInMiliseconds=2000
This diagnostic includes three additional parameters which can be adjusted in order to test less-common connection issues.
| Parameter | Values | Purpose |
|---|---|---|
| timesToCallServer | Min: 30 Max: 7200 | Controls how many times the test is run. Useful when you believe the connection issue may be related to repeated connections to Glassix, or when the issue only occurs after a certain length of time. |
| arrayBatchSize | Min: 10 Max: 100 | Controls the size of the test data. Useful when you believe the connection issue may be related to bandwidth, connection volume or data limits. |
| delayBetweenRequestsInMiliseconds | Min: 1000 Max: 10000 | Controls the delay between each test. Useful for increasing the length of the test when the issue only appears after some time. Also useful for catching more intermittent issues by spreading out the tests over a longer period of time. |
If you are having connection issues which only appear sporadically throughout the work day, the following pre-configured link will run an 8-hour diagnostic with tests at 4-second intervals: 8-hour diagnostic.
You can leave the test running in a separate browser tab or window. Any issues which are caught throughout the day will be reflected in the diagnostic as a less-than-100% score on any or all of the three final tests:
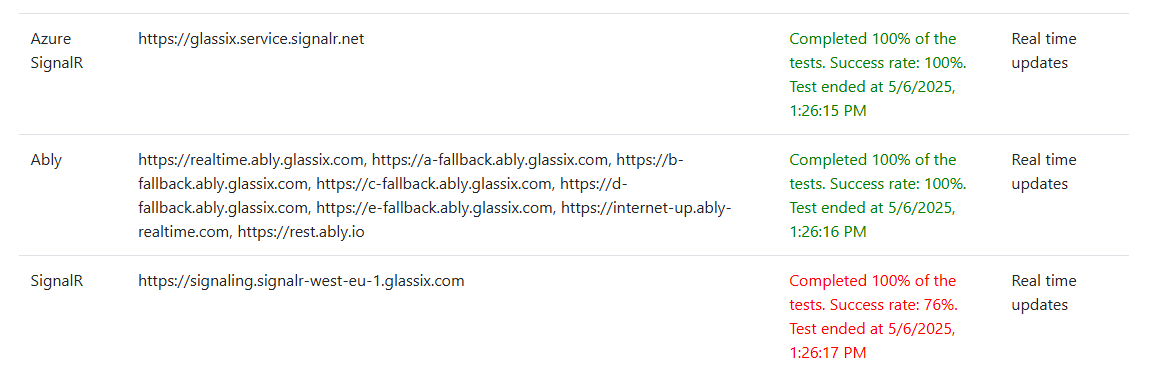
As with the standard diagnostic, if you discover any connection issues when running the in-depth diagnostic, please reach out to your IT team and ask them to investigate the issue.
Additional Troubleshooting Steps
Whenever you experience any of the issues mentioned above, it is also important that you take a few additional steps to help understand where the problem is. These steps should always be taken by you and your IT team before reaching out for support:
-
Troubleshooting Step: Connect to Glassix from a different network.
If This Fixes The Issue: Your network is preventing a stable connection to Glassix. This is generally related to network-level firewalls and security configurations.
Resolution: Ask your IT team to review your network's firewall and security configuration. They will need to make sure that all domains Glassix uses are allow-listed and that your network allows full and uninterrupted access to Glassix.
-
Troubleshooting Step: Connect to Glassix from a different browser.
If This Fixes The Issue: Your browser does not have a stable connection to Glassix. This can be due to things like browser extensions or browser-specific VPNs preventing communication with Glassix servers.
Resolution: Ask your IT team to review your browser configuration. If you manage your own browser, you will need to locate the extension or configuration which is preventing you from connecting to Glassix.
-
Troubleshooting Step: Connect to Glassix from a different device.
If This Fixes The Issue: Your device does not have a stable connection to Glassix. This can be due to things like VPNs, firewalls, network security or anti-malware software.
Resolution: As your IT team to review your device's configuration. If you manage your own device, you will need to locate the software or configuration which is preventing your device from connecting to Glassix. You should also make sure your device has a stable internet connection.
-
Troubleshooting Step: Connect to Glassix without your VPN.
If This Fixes The Issue: Your work network or VPN software is preventing a stable connection to Glassix. This is generally related to network-level firewall and security configurations on your work network, but may also be related to your VPN software itself.
Resolution: Ask your IT team to review your work network's firewall and security configuration. They will also need to make sure that your VPN software is not causing connection issues.
-
Troubleshooting Step: Check with your IT team to see if any recent changes were made to your company's security configuration.
If Yes: It is likely that a recent change to your company's security configuration is preventing you from connecting or staying connected to Glassix.
Resolution: Ask your IT team to revert the change, or to identify what in the change may be affecting your connection to Glassix. It is likely that your team will need to review Domains Glassix Uses again and ensure that all domains are accessible after the change.
The Browser Console
If you have run through all of the tests above and you still have an unidentified issue, the final tool available for checking on potential issues is the browser console. These logs are quite technical, so you may want to review these alongside your IT team if you don't feel comfortable reading them yourself.
Tip:The browser console only starts logging and reporting events from the moment it's opened, and for the tab it's opened in. If you're experiencing an intermittent issue, it's recommended to open the console ahead of time in your browser tab and leave it open while you work in that tab.
To open the browser console:
- Windows
- Chrome: F12 or More Tools > Developer Tools, then select the Console tab
- Edge: Ctrl+Shift+I or More Tools > Developer Tools, then select the Console tab
- Firefox: Ctrl+Shift+J or More Tools > Browser Console
- Mac
- Safari: Option+Cmd+C or Develop > Show JavaScript Console
- Chrome: F12 (fn+F12 on laptops) or More Tools > Developer Tools, then select the Console tab
- Firefox: Cmd+Shift+J or More Tools > Browser Console
Glassix reports a number of both success and failure events in the browser's console which can assist your team in understanding the specific connection issue you're experiencing:
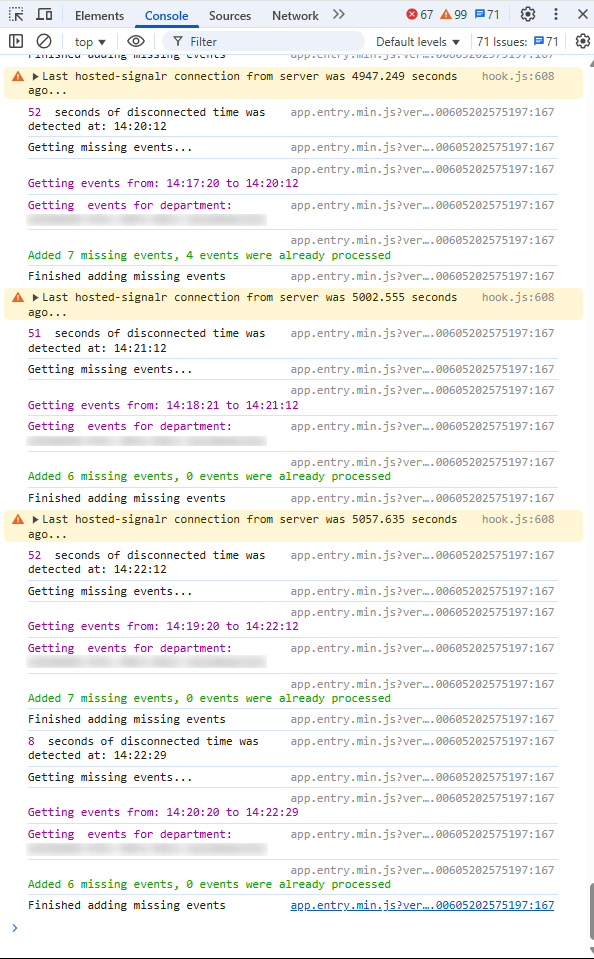
It's normal to see a number of informational logs in the console at any given time. If you're seeing a lot of disconnection events, or if there are any events in red, these will likely indicate an issue that your IT team will be able to help resolve.
Updated about 1 year ago