Dashboards Overview
View and manage agent performance
Info:Every dashboard, both default and custom, displays data from the current day only. Dashboard data resets every midnight based on your timezone.
Prerequisites
Learn about adding widgets to your dashboards here.
Overview
This article covers the Glassix dashboard, including how to access it, the types of dashboards available, and how to configure them to suit your workflow.
The dashboard provides a real-time visual overview of key metrics and is the primary tool for team leaders and shift managers to monitor their teams. In addition to viewing agent performance, the dashboard lets you manage your team by setting agent statuses, updating ticket assignment limits, and changing priority tags.
Accessing the Dashboard
To view and manage your dashboards, click the Dashboard icon in the left-hand sidebar:
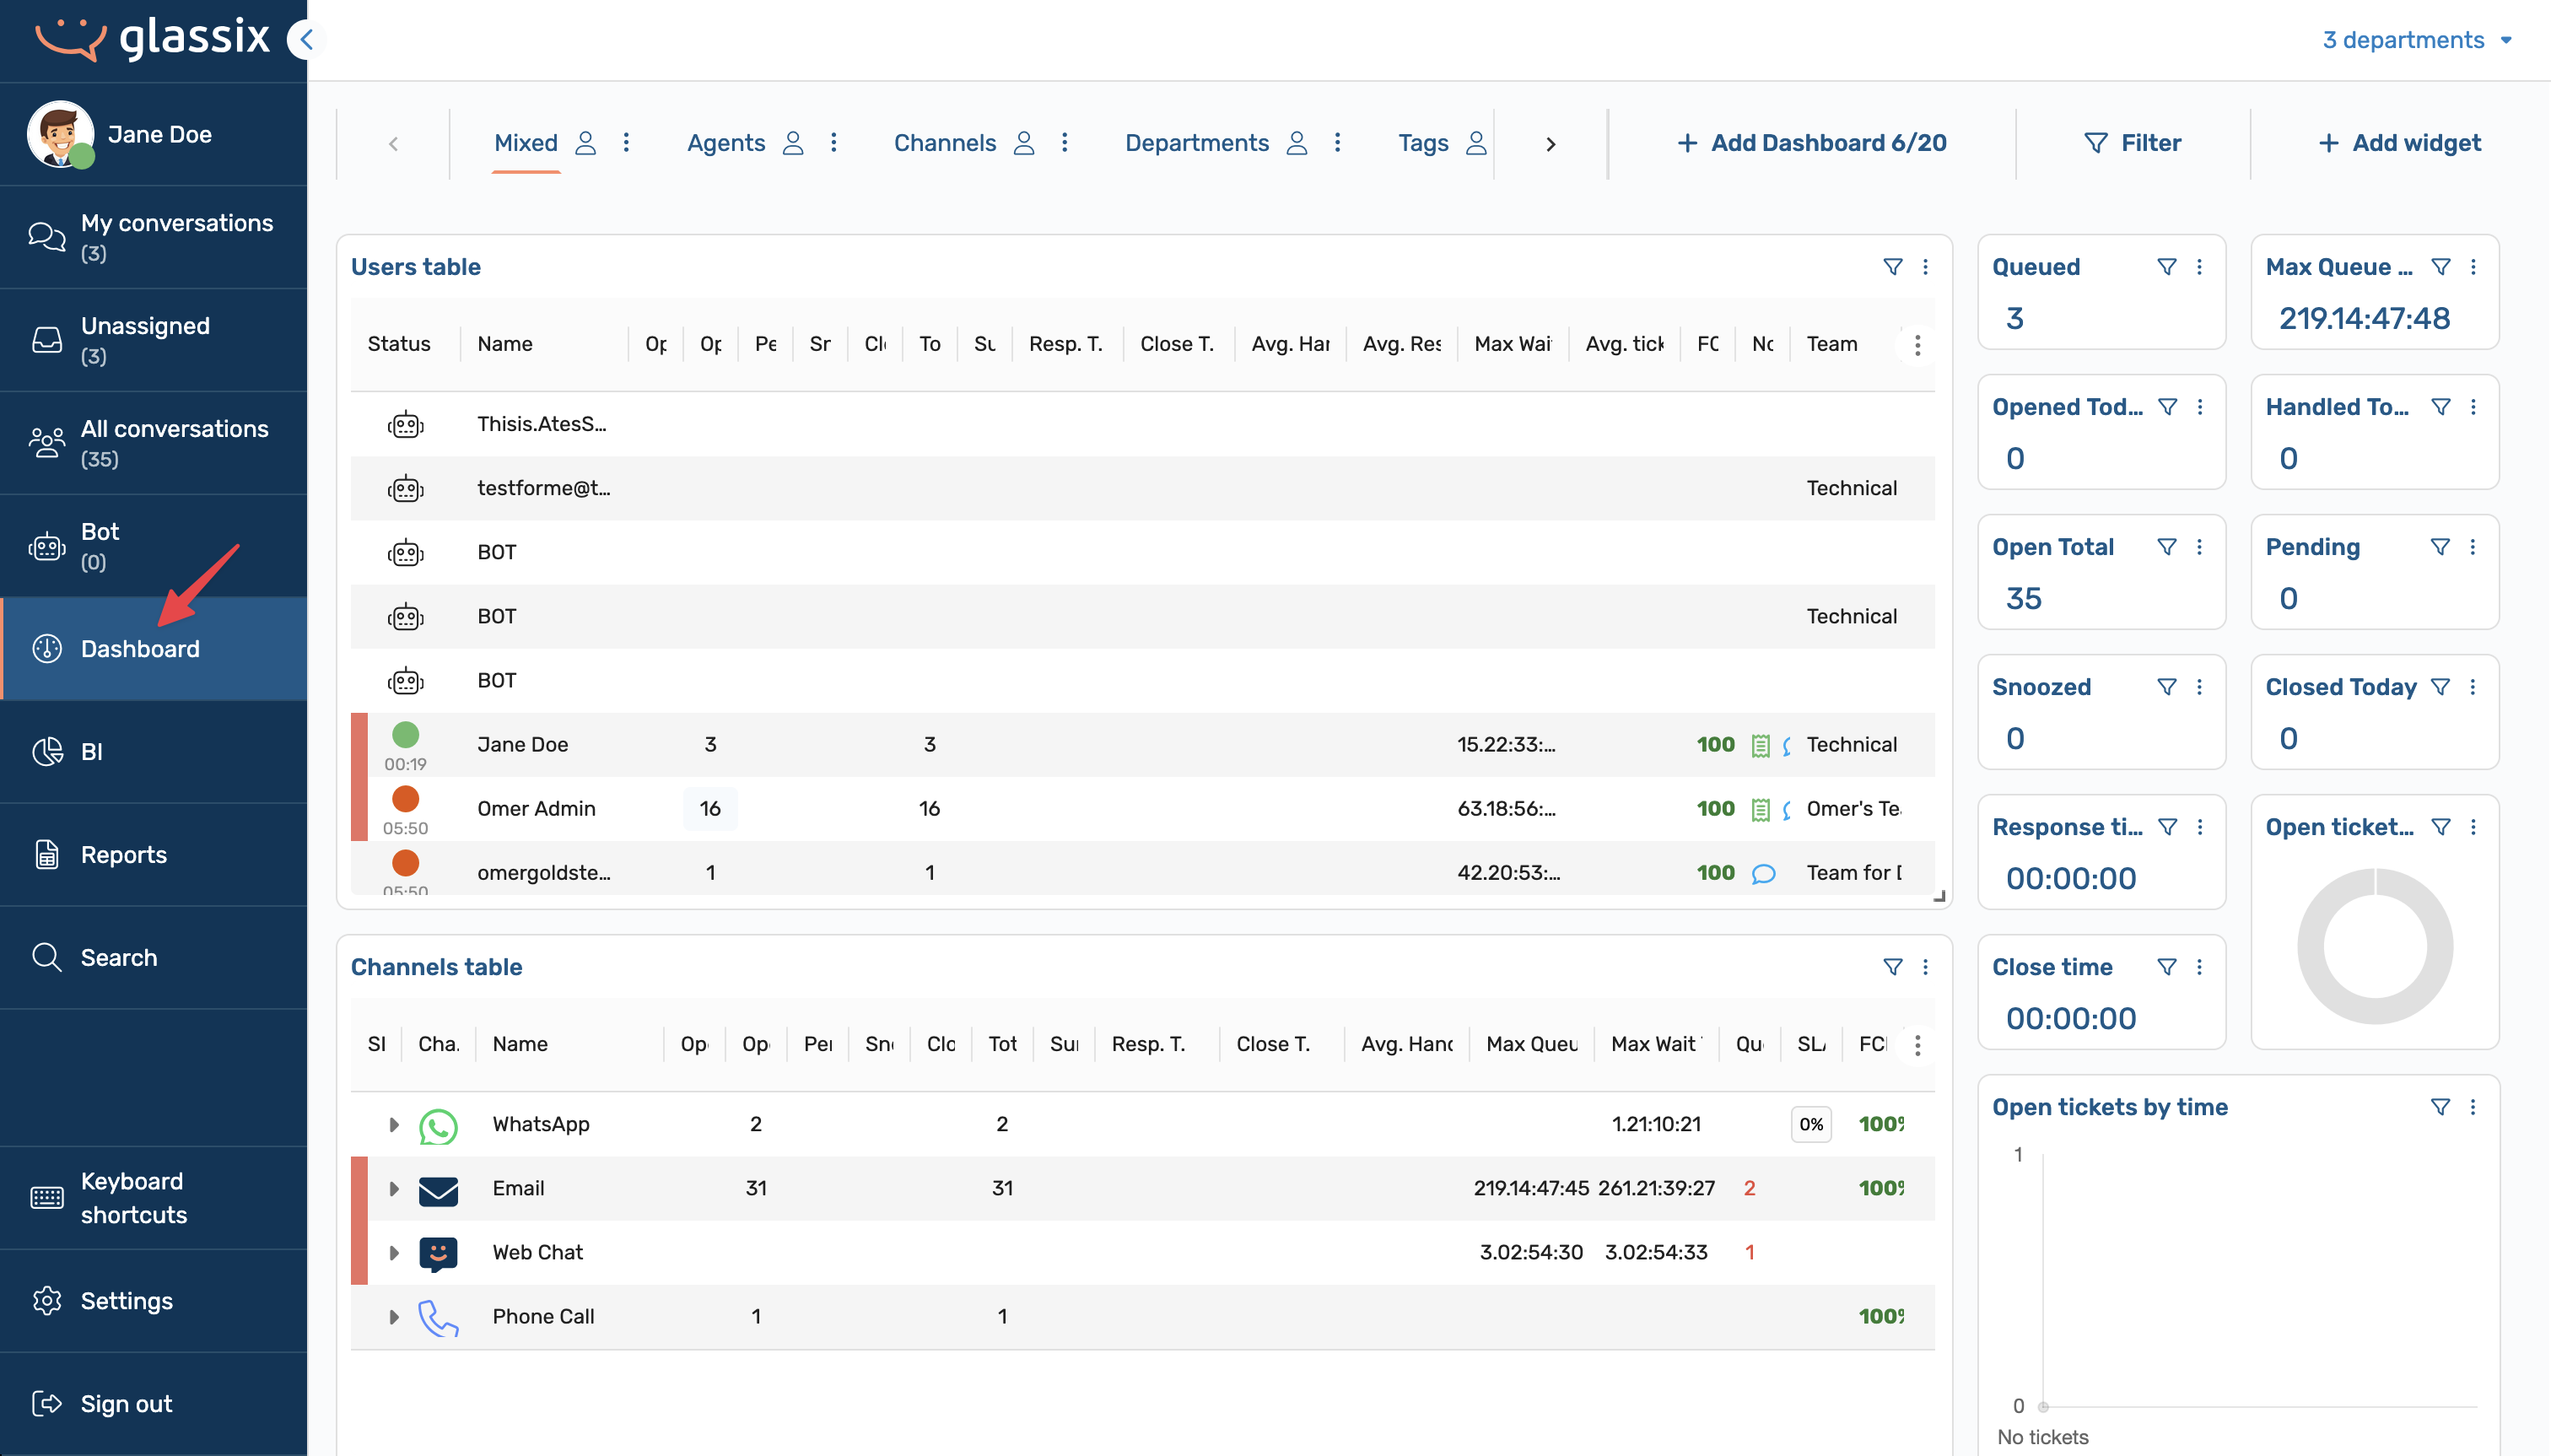
This opens the dashboard view. By default, you will see the My Performance dashboard, which displays your personal performance metrics.
My Performance Dashboard
Info:The My Performance dashboard is available to all agents in the workspace. Only workspace admins can edit it, and any changes apply to all users in the workspace.
All agents can view their personal performance and statistics on the My Performance dashboard:
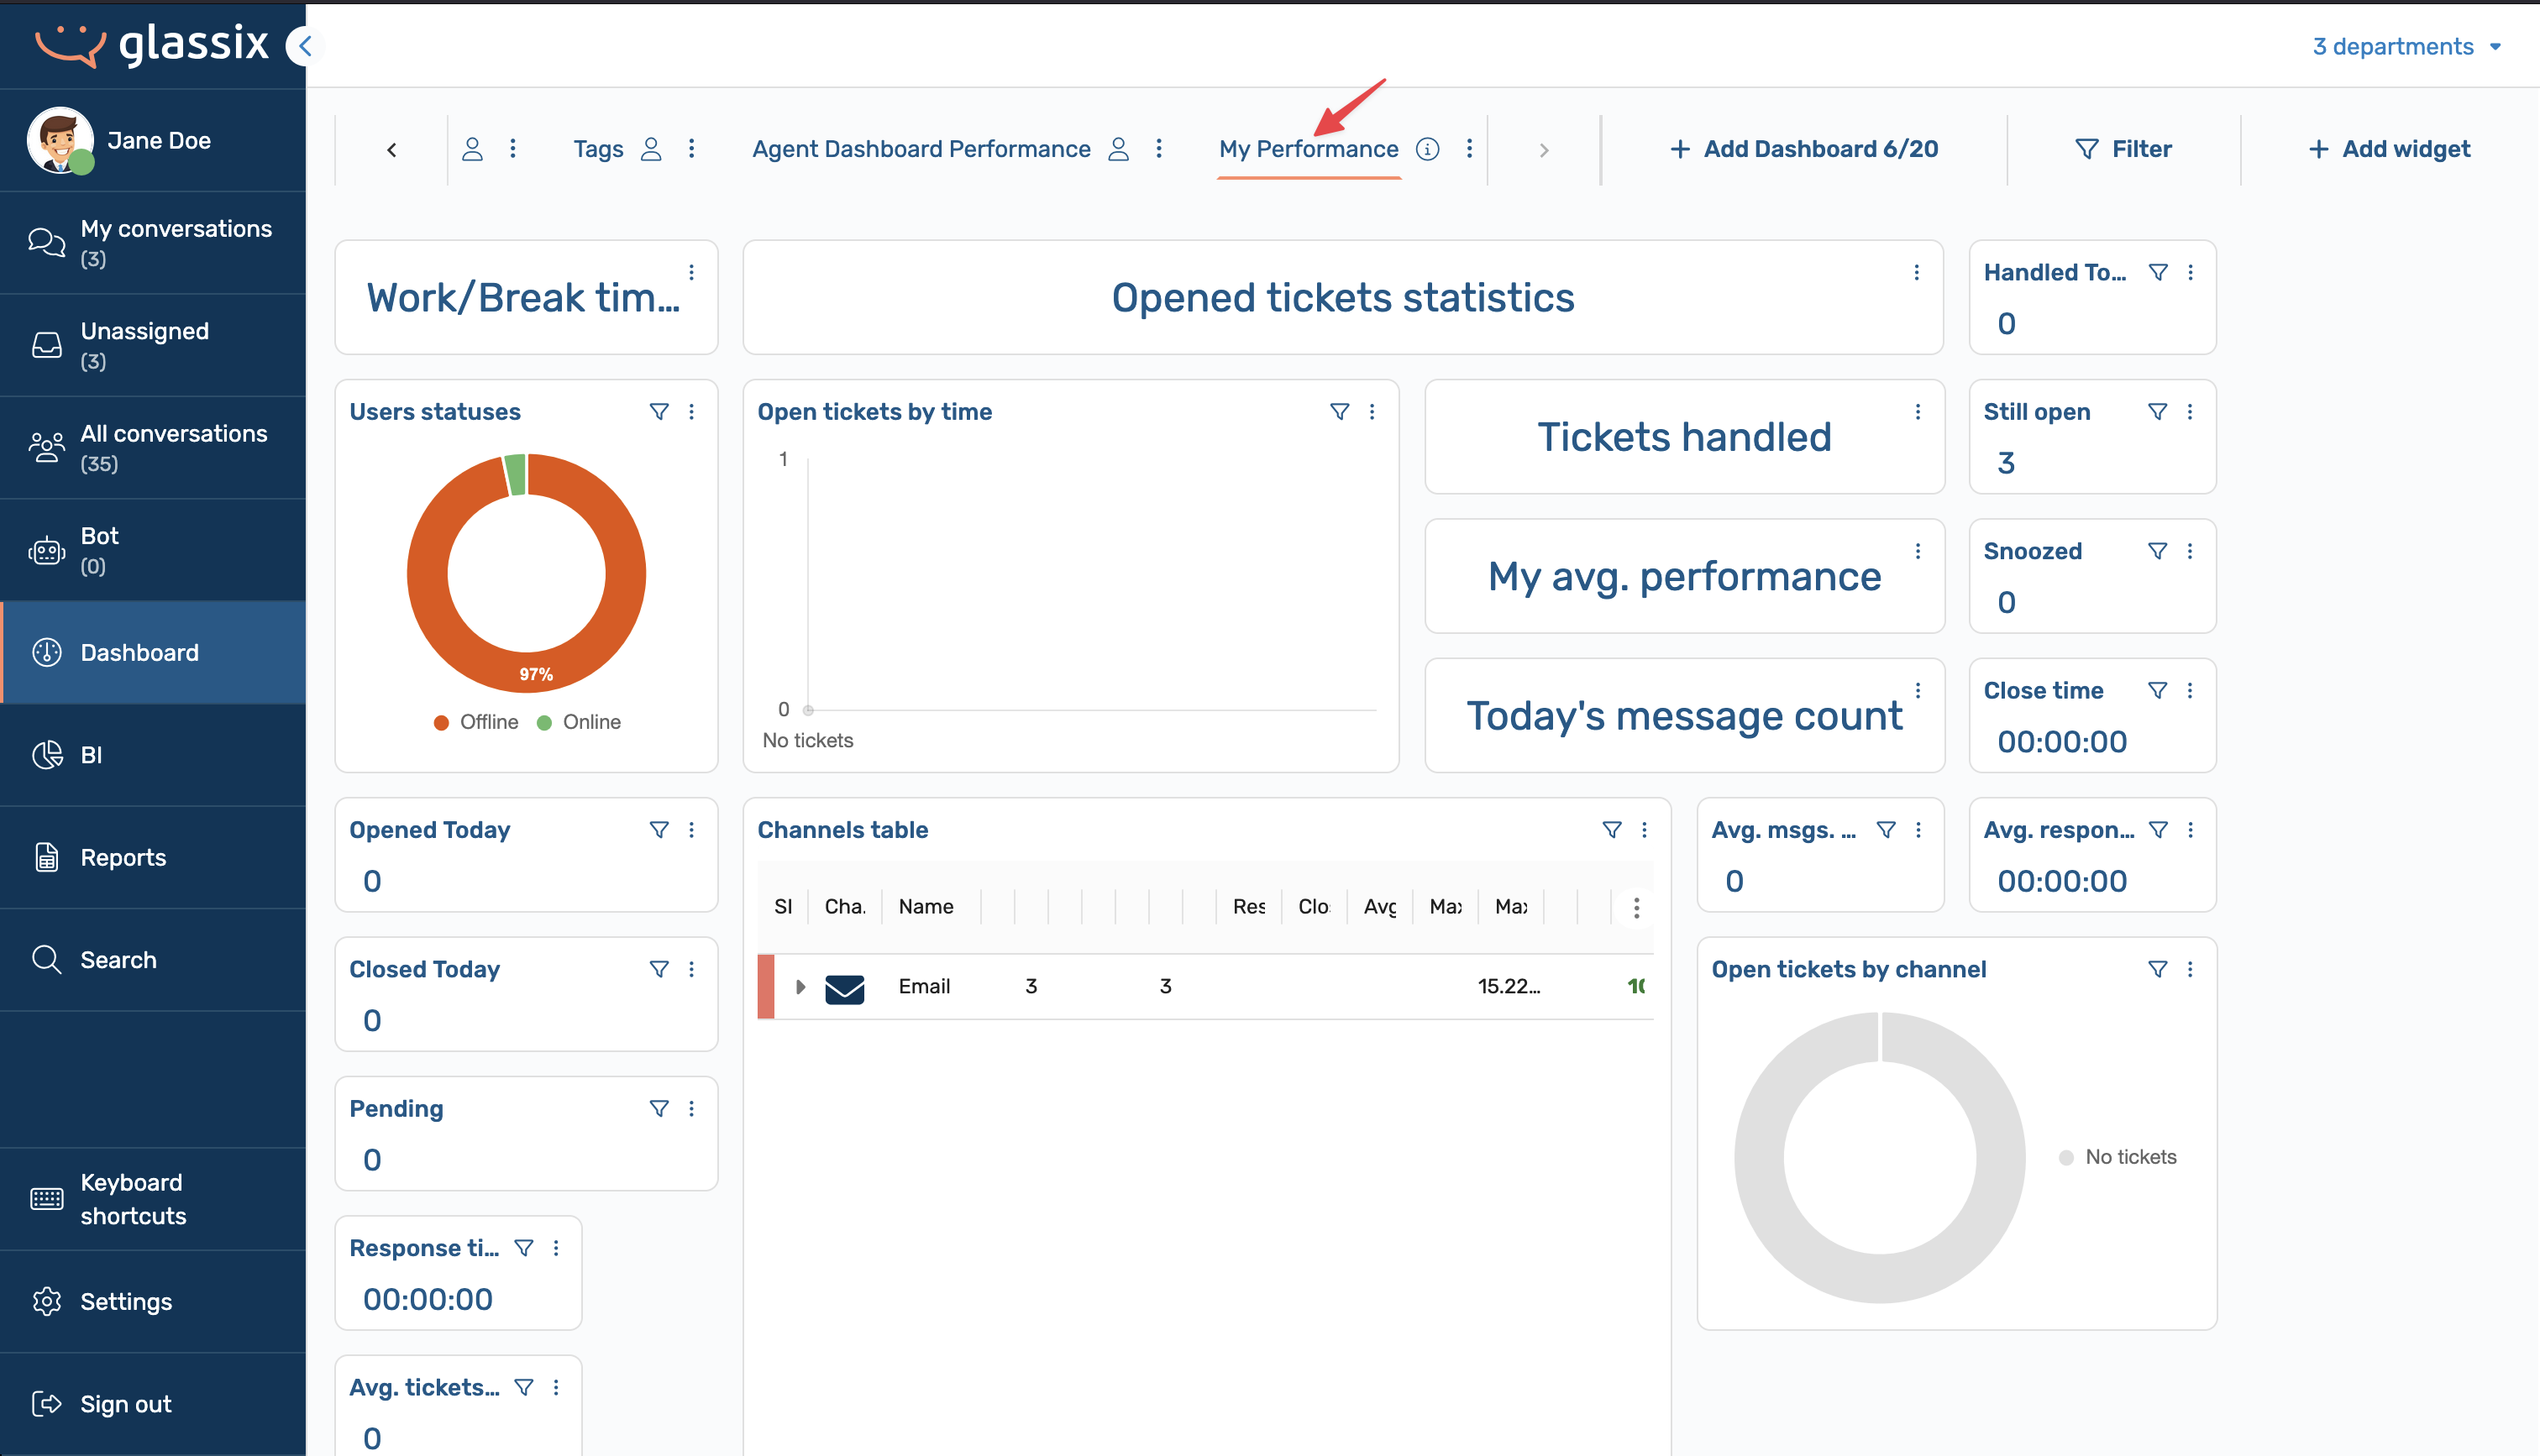
This dashboard displays time worked, tickets currently being handled, and other KPIs useful for tracking daily performance, as well as information for prioritizing tasks such as work and break times.
All data on the My Performance dashboard reflects the currently logged-in user only and, like all dashboards, is limited to the current day.
The My Performance dashboard is a standard view across the workspace. Workspace admins can edit this dashboard just like any other, and all changes take effect workspace-wide.
Default Dashboards
All workspaces include five default dashboards, in addition to the My Performance dashboard. These defaults give managers and team leaders a full overview of agent performance and serve as a useful starting point for new workspaces.
Tip:Default dashboards can be removed to make room for custom dashboards. For more information, see Add a New Custom Dashboard.
Default dashboards can be edited and customized like any other dashboard. If you are not ready to build custom dashboards yet, we recommend starting by editing these defaults.
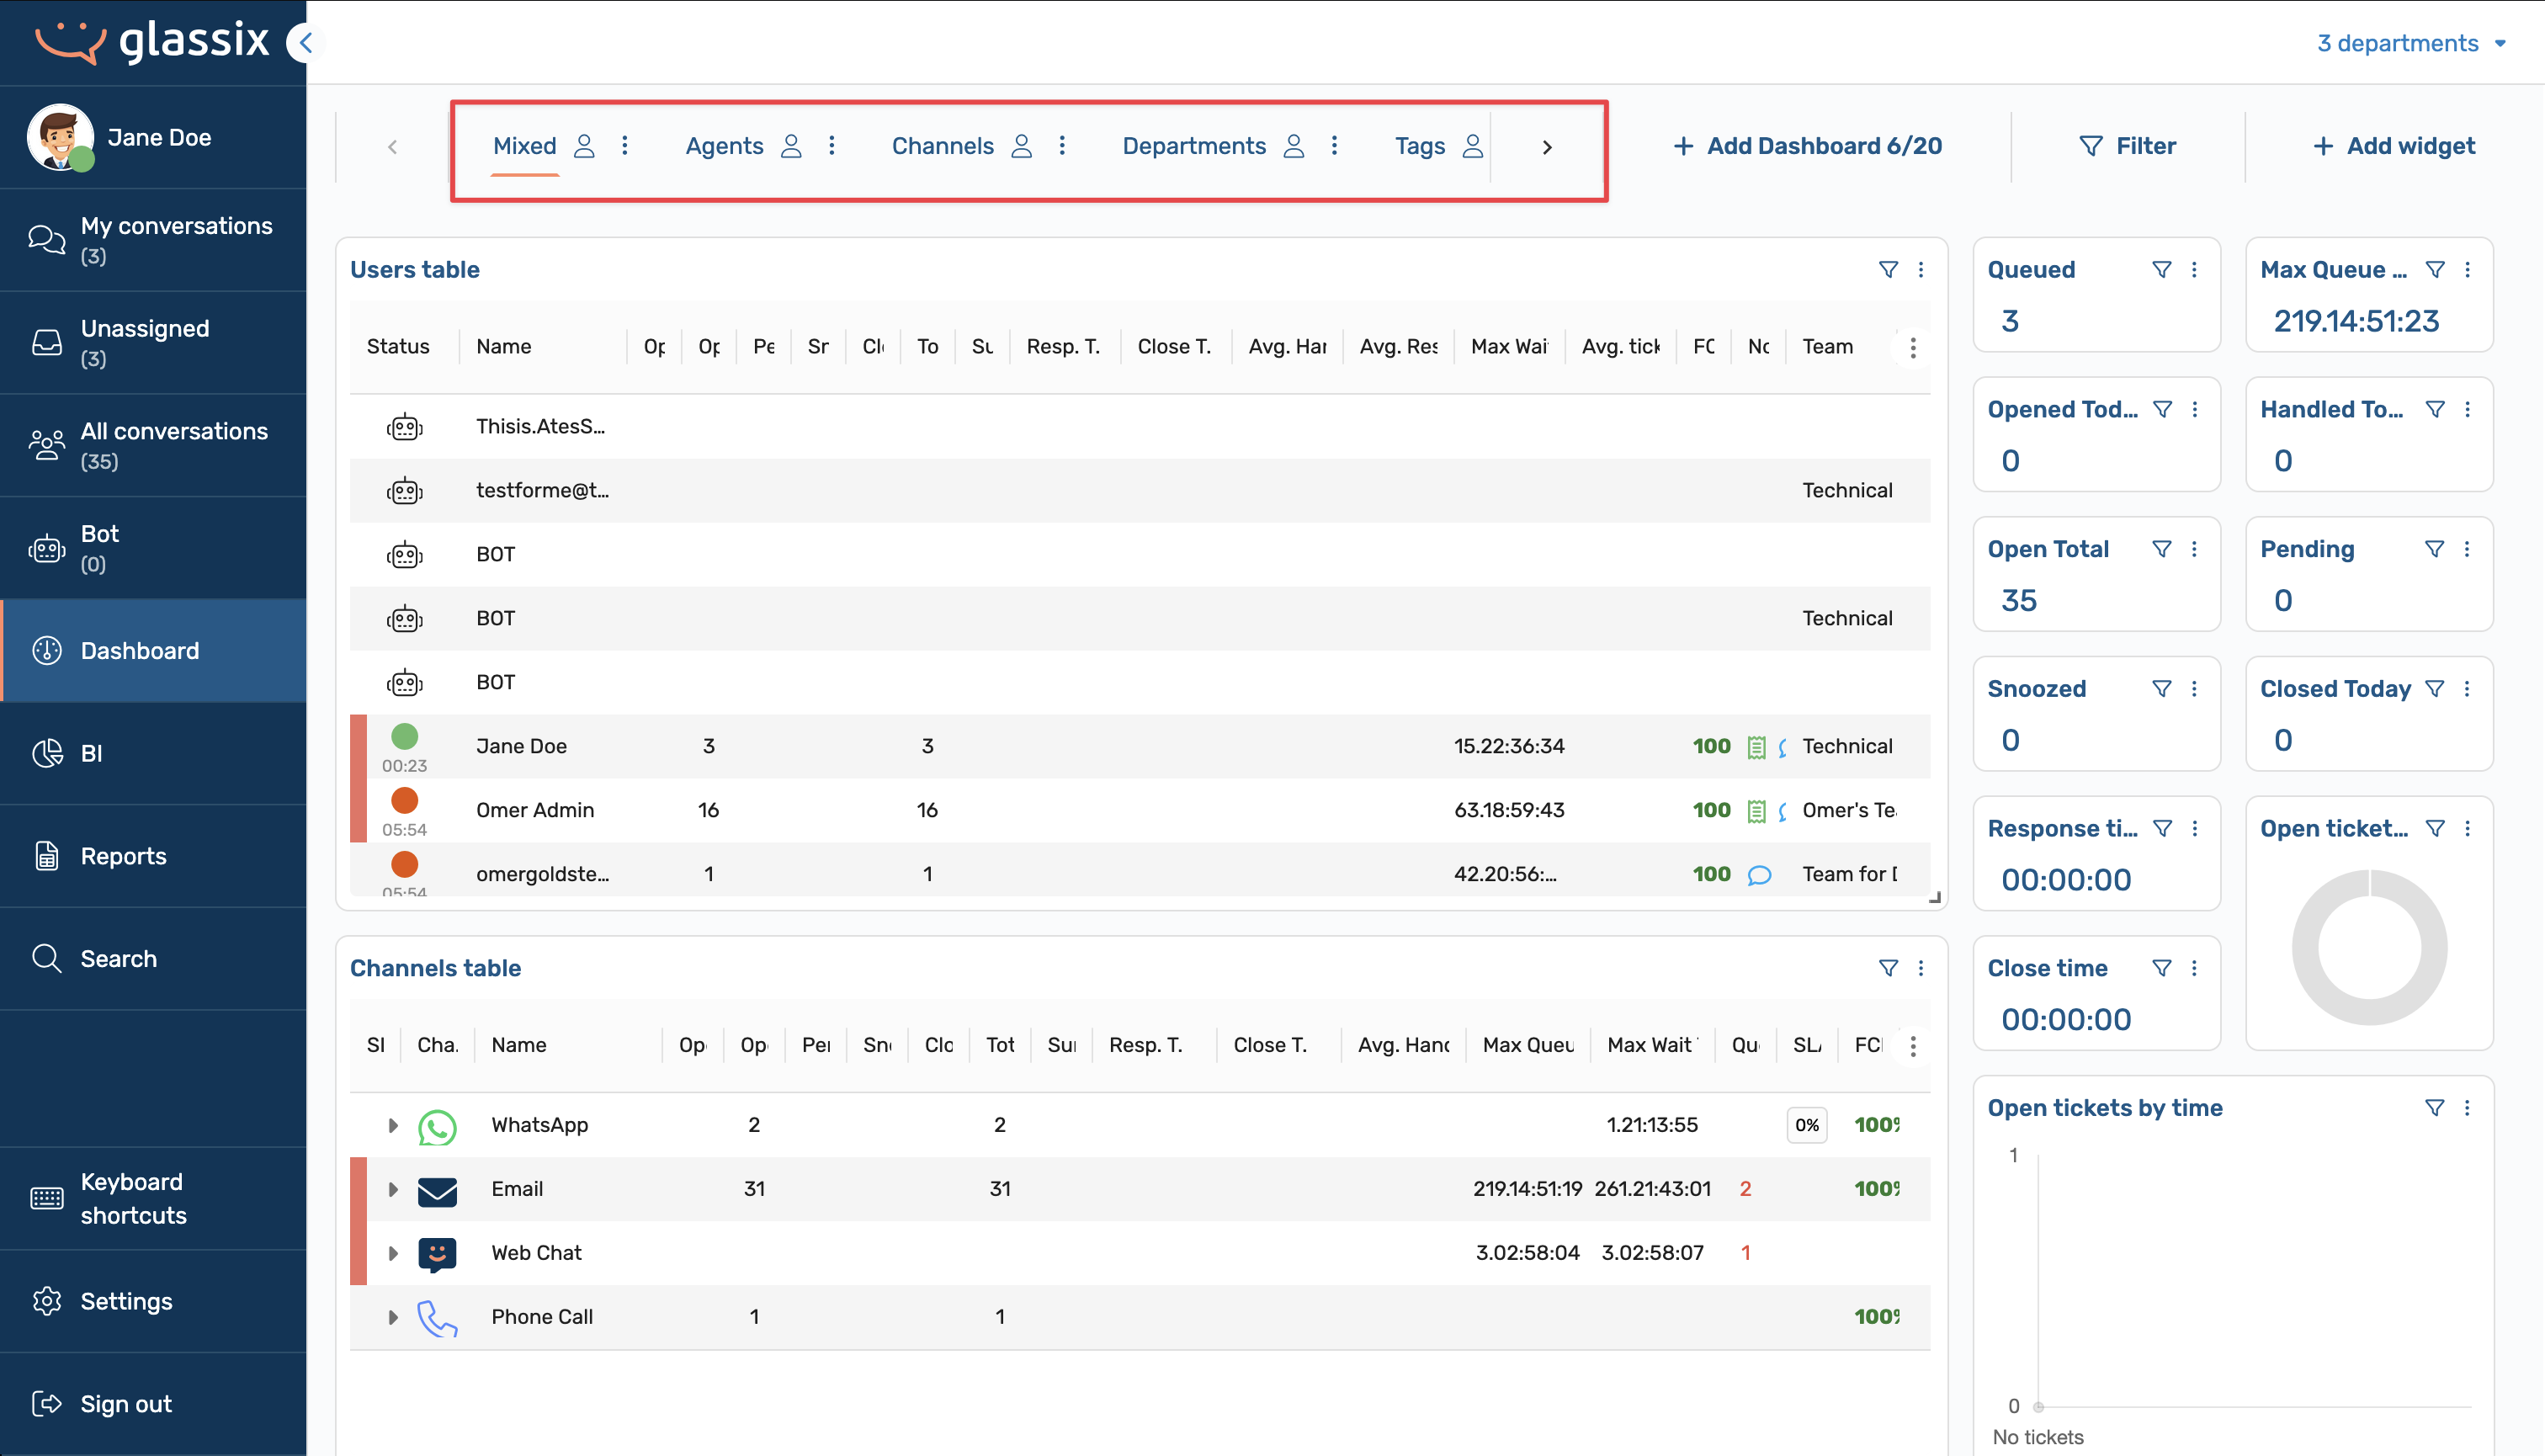
All default dashboards share a standard set of tile widgets and differ only in their primary data tables. The five default dashboards and their primary data tables are:
- Mixed: Combines user-level and channel-level data into a single view. This is the most comprehensive default dashboard.
- Agents: Focuses on individual-agent metrics, such as open tickets, response times, and handling statistics.
- Channels: Displays metrics organized by communication channel (for example, WhatsApp, email, web chat, and Messenger).
- Departments: Groups performance data by department, allowing managers to compare metrics across teams.
- Tags: Shows ticket data organized by tag, useful for tracking specific categories or workflows.
Dashboard Options
Info:Dashboard management options are available to users with a team leader role or higher.
The top of the dashboard page contains controls for selecting dashboards, creating new ones, filtering data, and adding widgets.
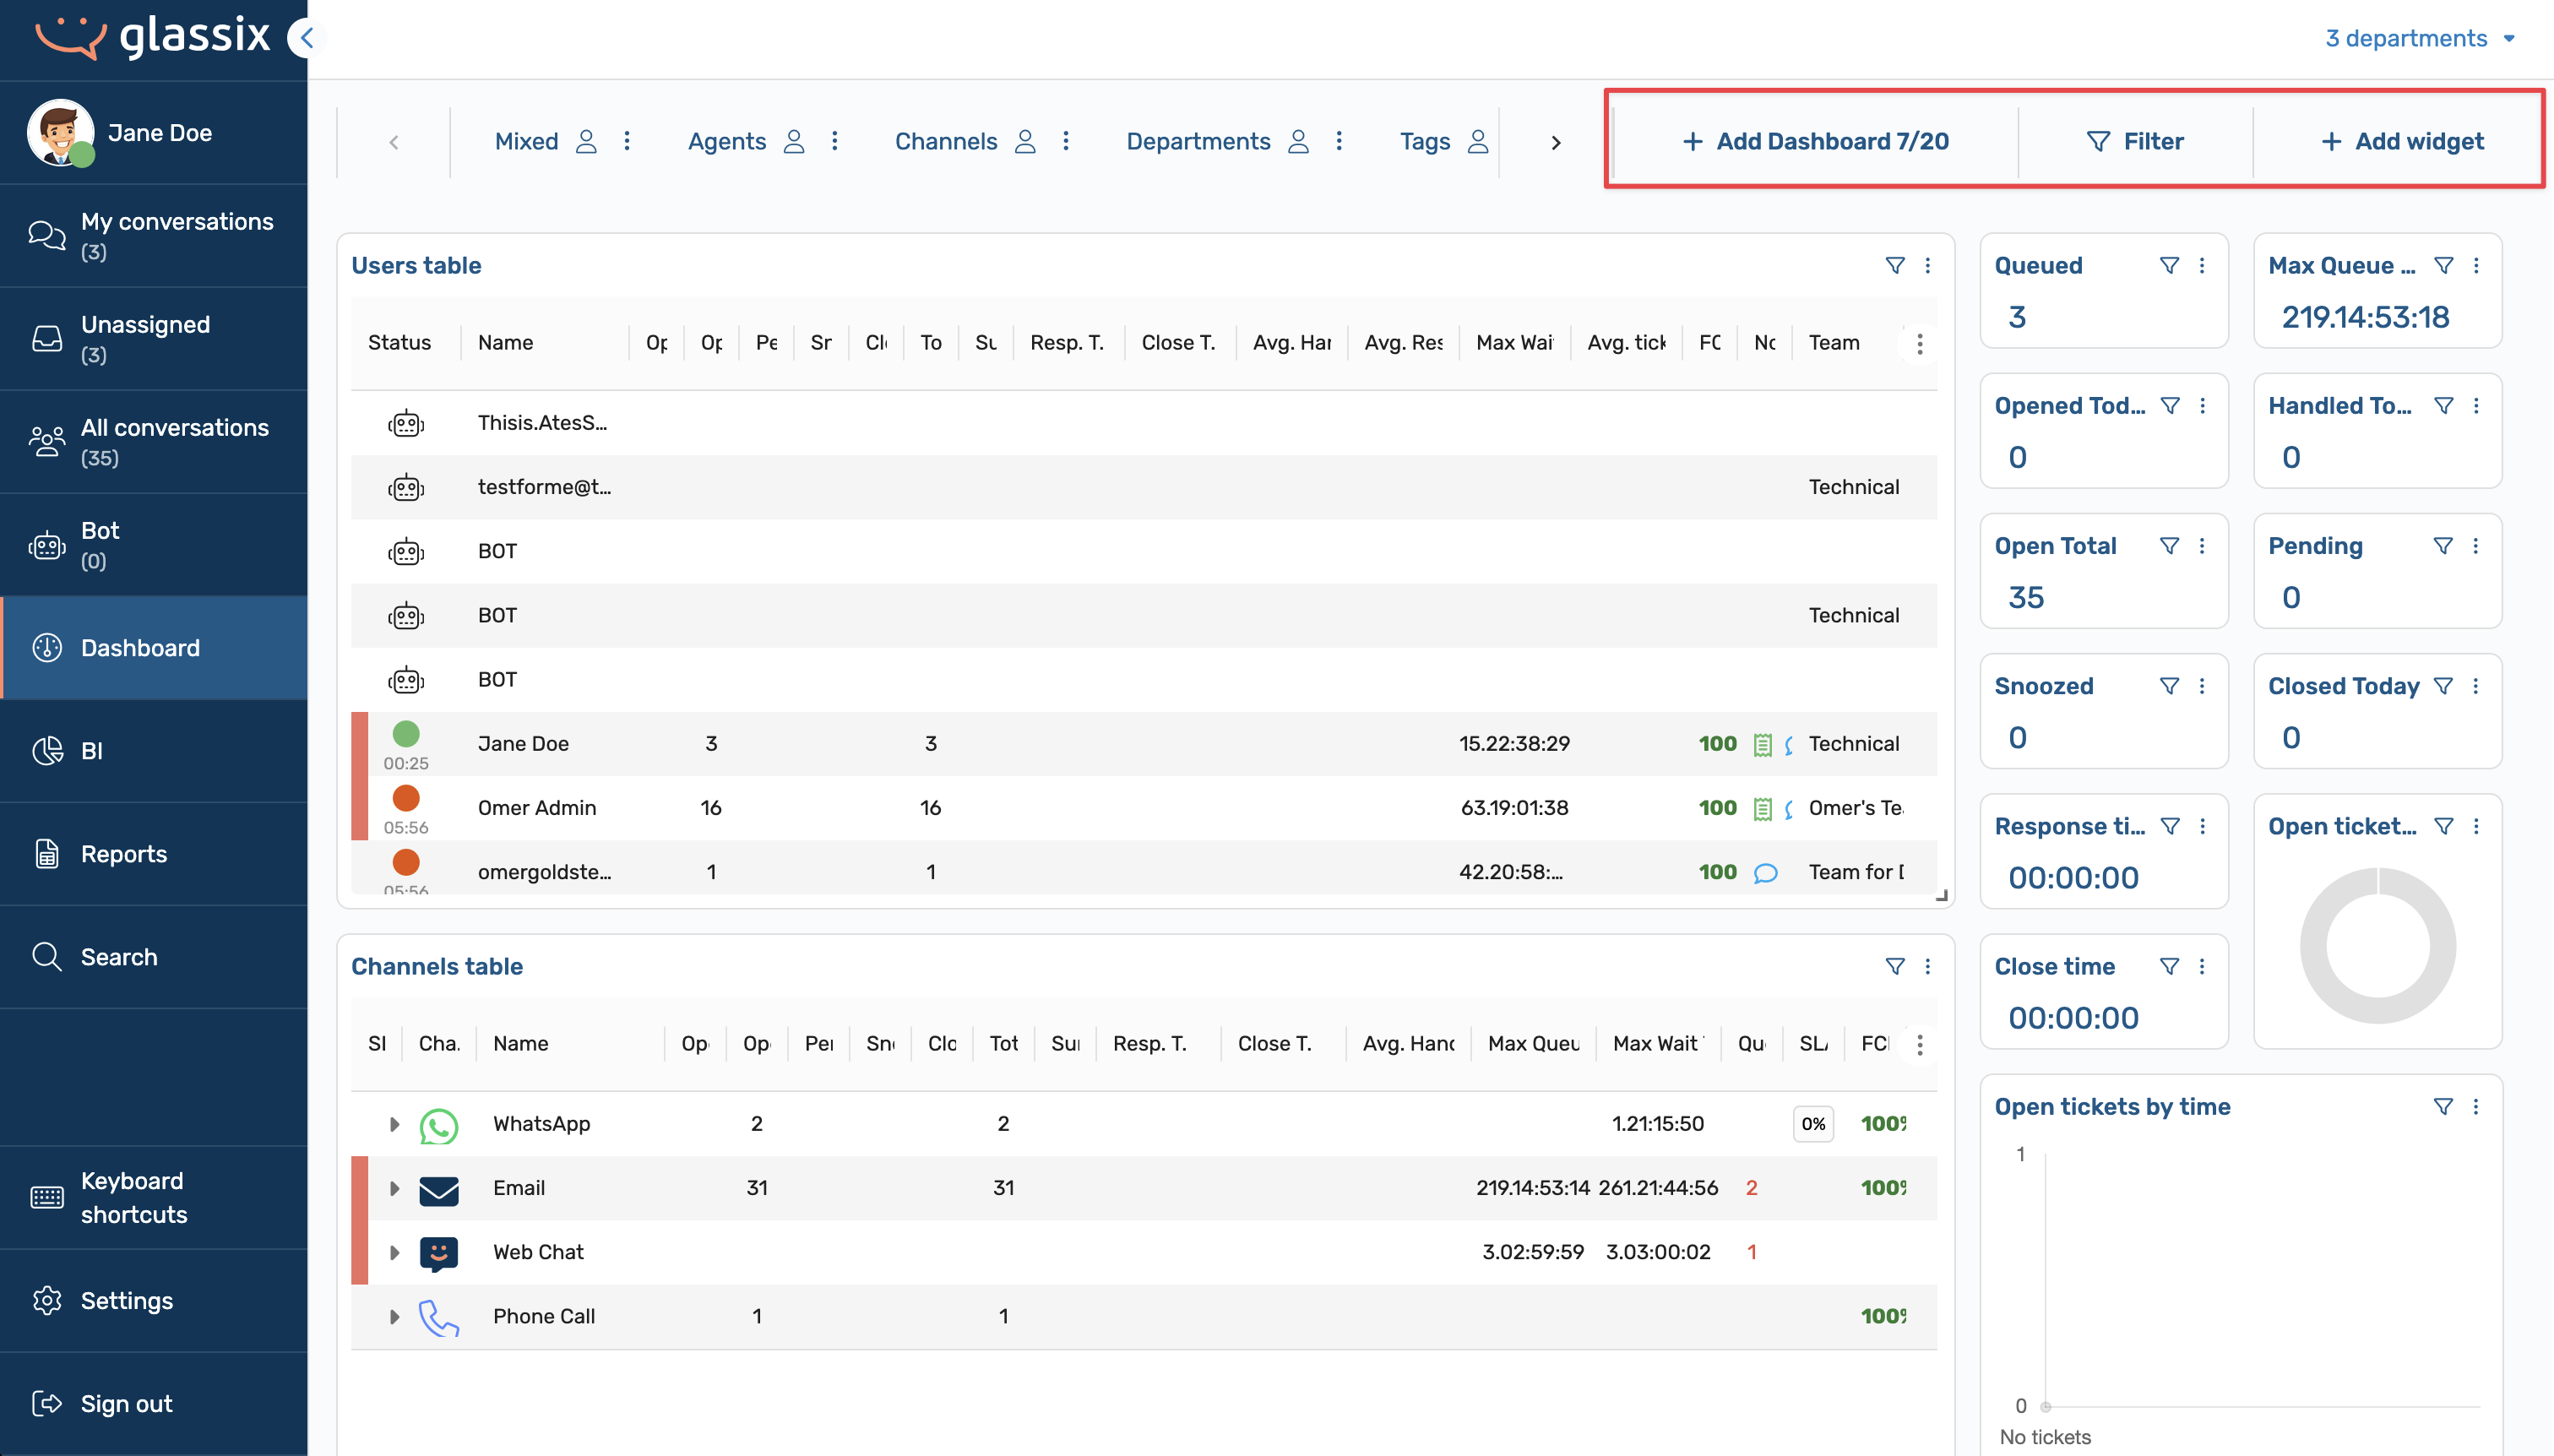
From this header, you can:
Switch between dashboards by clicking on any dashboard tab. Use the left and right arrow buttons to scroll through available dashboards if they do not all fit on screen.
Create a new dashboard by clicking + Add Dashboard. Up to 20 dashboards can be created per workspace. New dashboards are created with a default set of widgets focused on time and ticket management, such as Work/Break Time, Opened Ticket Statistics, Tickets Handled, User Statuses, and Open Tickets by Time.
Info:Give each new dashboard a unique name to make it easy to identify. By default, new dashboards are named "New dashboard."
Filter dashboard data by clicking the Filter button. Filters narrow down the data displayed across the current dashboard. You can filter by department, communication protocol, user status, ticket type, or tag. Refer to this for more.
Add a widget by clicking + Add widget to open the widget menu, where you can browse and select from the full list of available widgets. For more information, see Add Dashboard Widgets.
Manage a dashboard by clicking the three-dot menu next to any dashboard tab. From here, you can rename, duplicate, delete, set access (public or private), make it read-only, or share the dashboard across teams.
Arranging and Resizing Widgets
Once widgets are added, you can organize them visually by dragging and dropping them anywhere on the dashboard. Refer to this for more.
Editing and Removing Widgets
Each widget has a three-dot menu icon in its top-right corner. From this menu, you can edit and delete Dashboards. Refer to this for more.
Updated 3 months ago
What’s Next
See Add Dashboard Widgets to learn about the configuration options available within your dashboard.