Reports Overview
Configure and run system, configured, custom and scheduled reports
Overview
Note:Because reports contain customer data, our support team cannot access them without full department access. If you ever need help with your reports, you must grant your Glassix contact full support access to your department before reaching out.
Info:Reports are available to admins and team leaders only. Regular agents cannot access the Reports section.
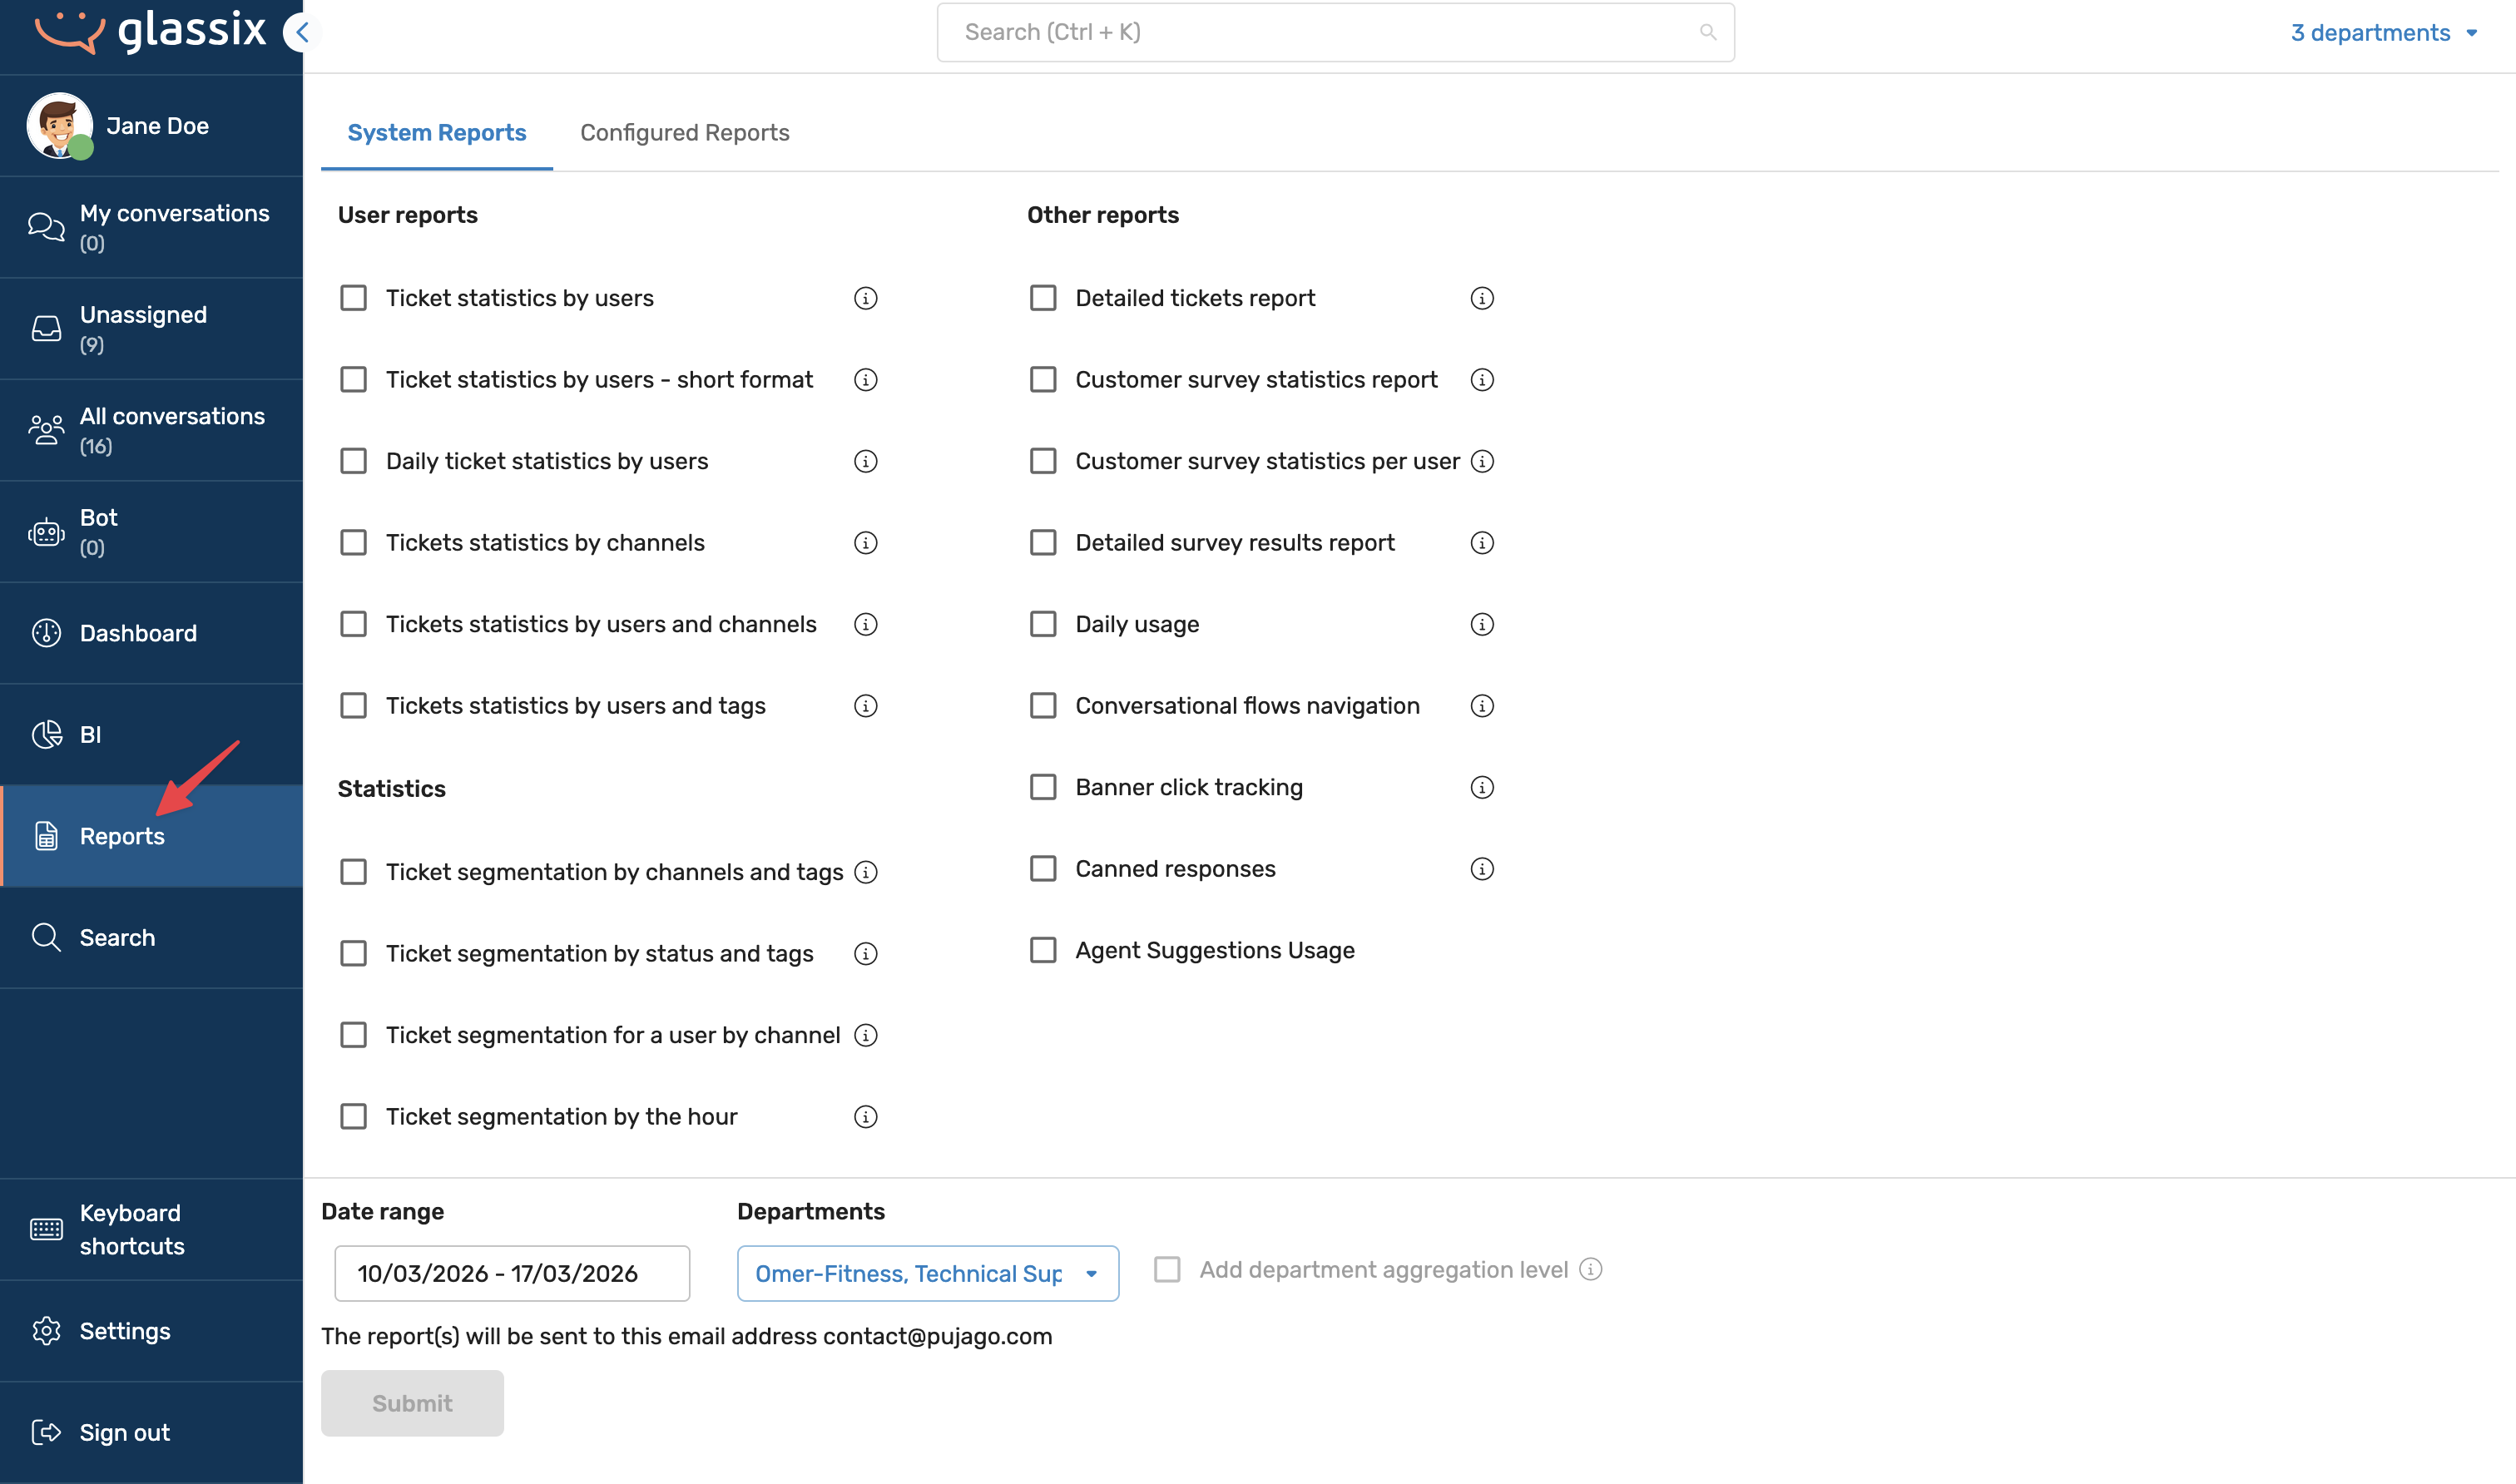
To navigate to reports, open the agent view and click on Reports in the left-hand menu:
Reports are department-specific. When you open the Reports screen, you are always viewing reports for one particular department. Custom reports you upload, fields you remove, and reports you run all apply to the department you are currently viewing, not your entire workspace.
You can run reports across multiple departments by adding additional departments from the report screen. See Multi-Department Reports below for important limitations.
Note:Reports can only cover a maximum of three months at a time. You cannot run a report for a longer time period, and neither can we. If you need data going further back than three months, you will need to use the API.
Tip:All report data is also available via the API, but the reports themselves (i.e. the generated Excel files) are not. There is no API endpoint that produces a downloadable report document.
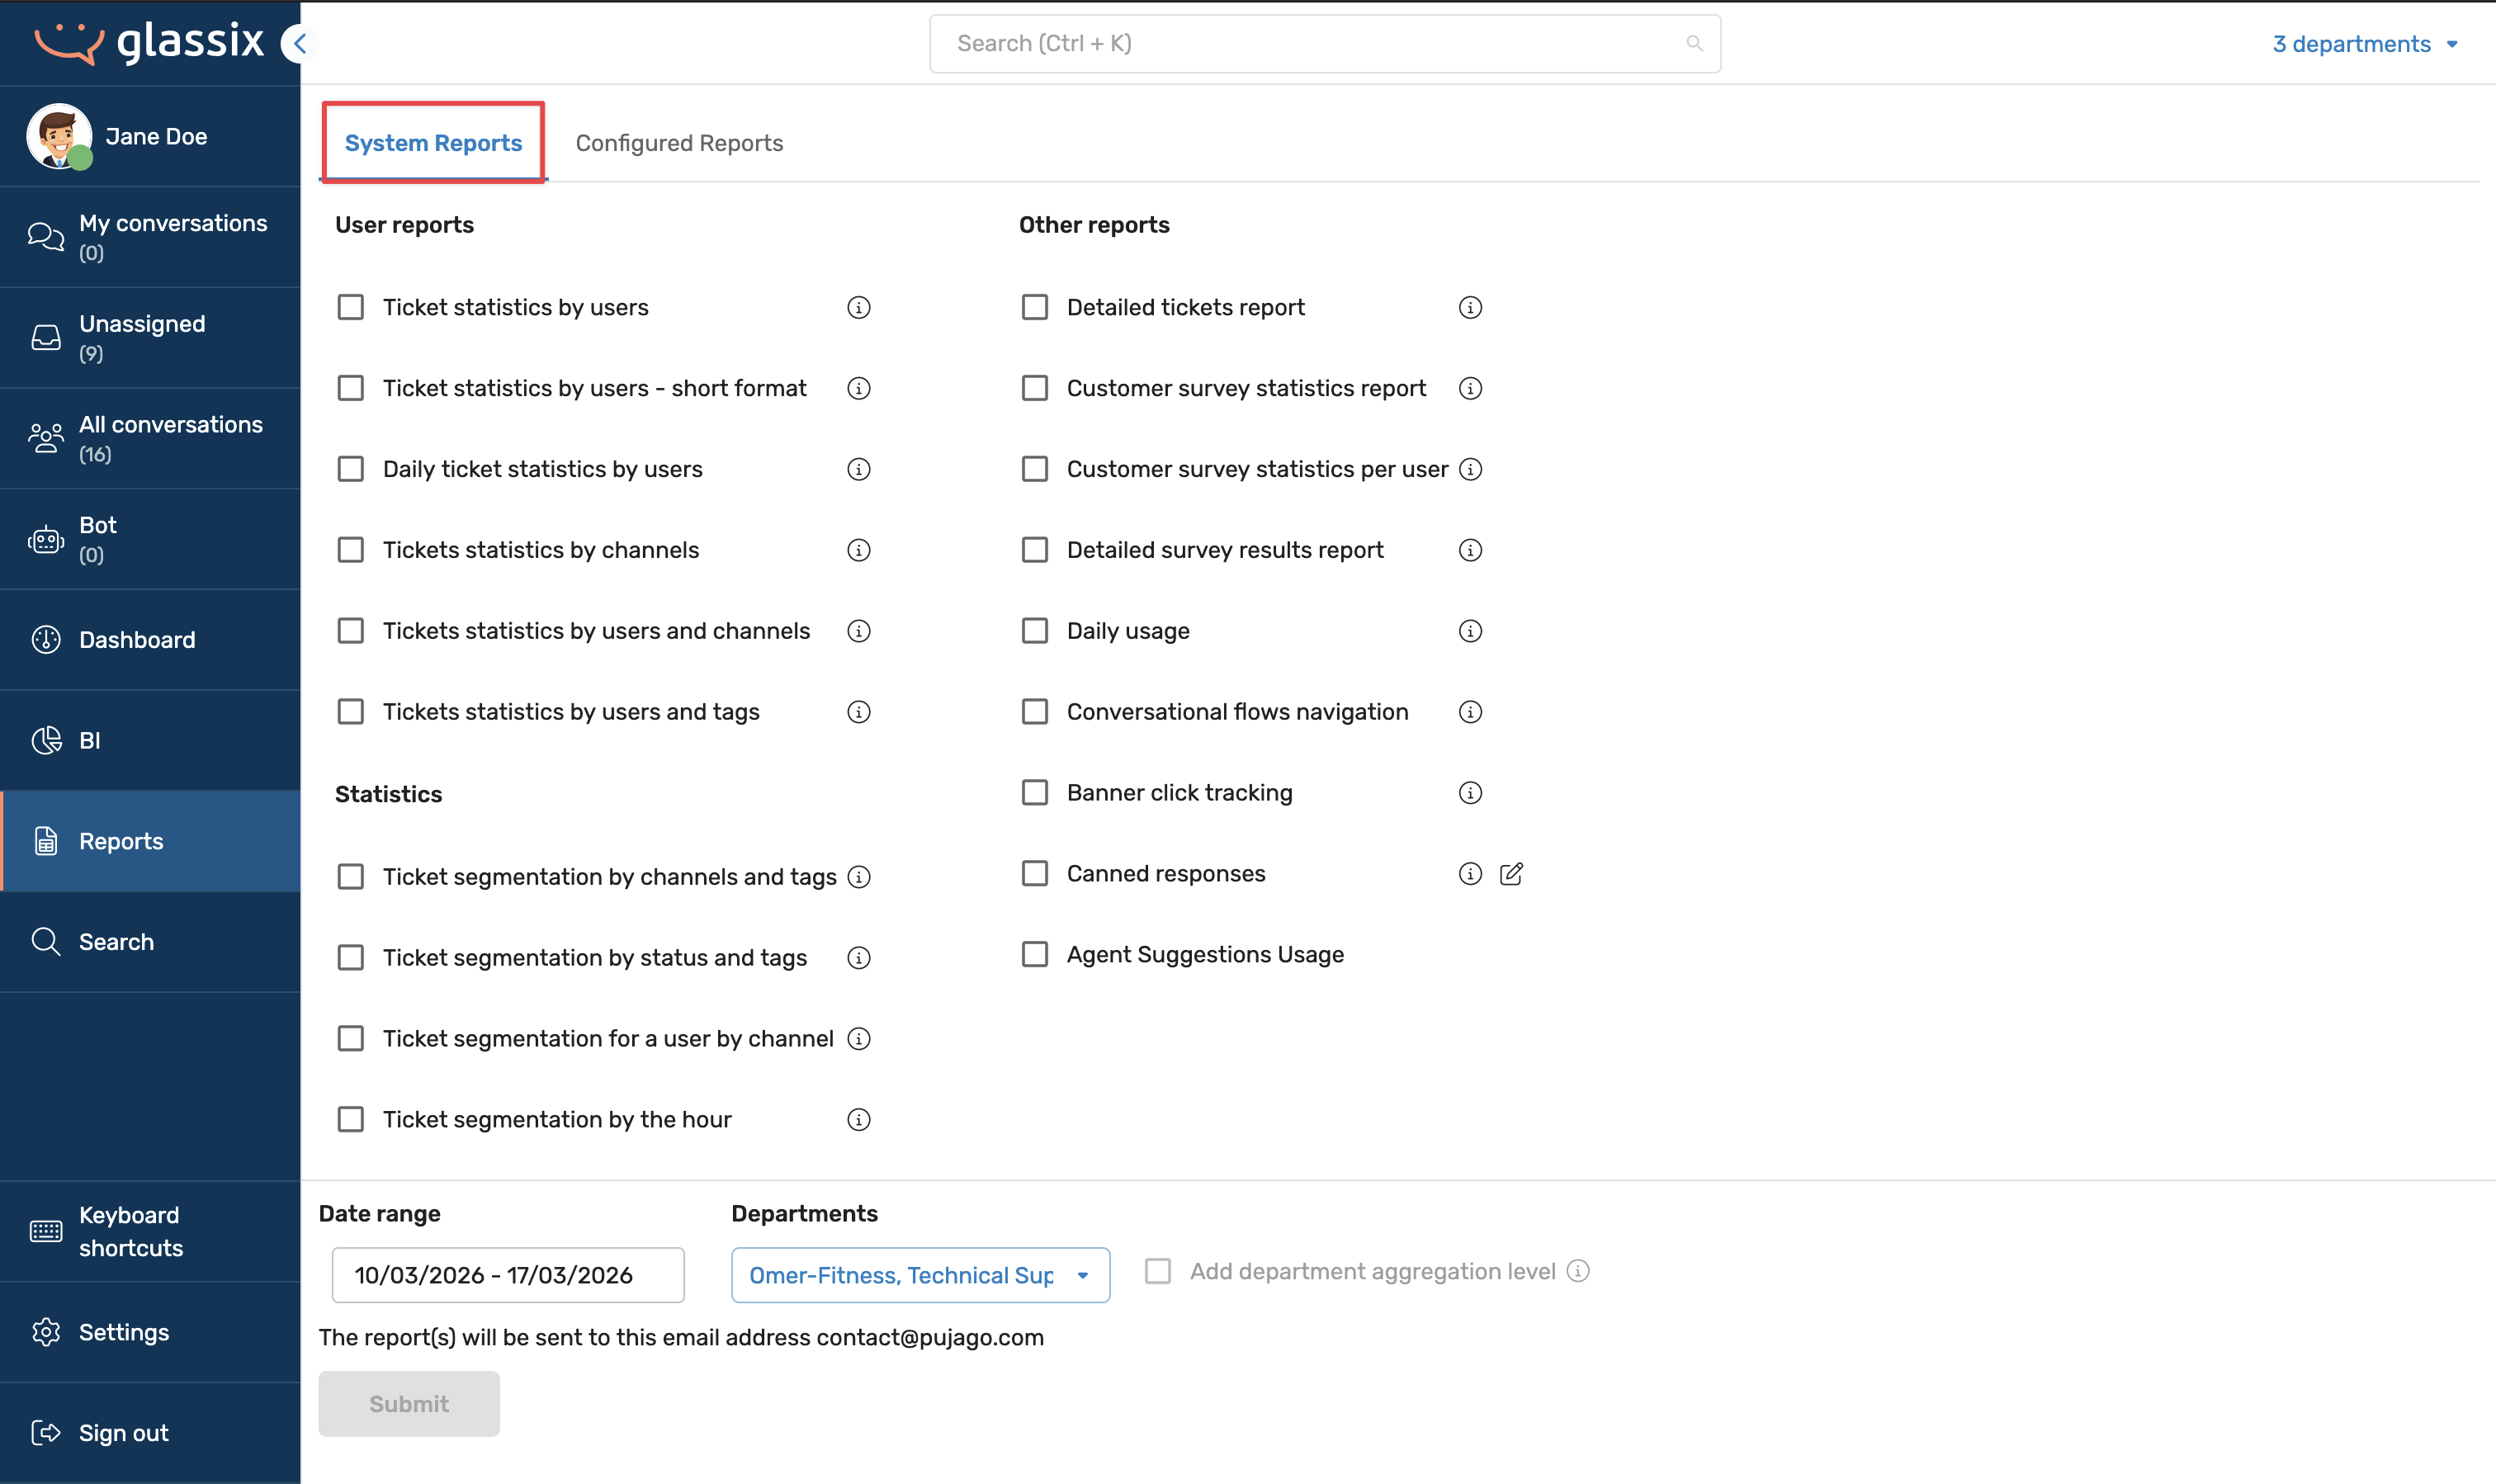
System Reports
System reports are built-in reports available to all departments. When you open a system report, you can remove fields you don't need, and you can also rename and rearrange fields. You can save a trimmed-down version. This saved version will appear under My Reports, and you can optionally share it with the rest of your department.
Reports added by an admin and shared with the department appear under Department Reports.
All system reports include a description to help you understand what data they contain. A few things worth noting:
Survey Reports
Survey reports are tied to a specific survey ID, not a survey name. This means:
- If a survey no longer exists, it will not appear in the report list.
- If you have ever duplicated a survey, the duplicate has a different ID even if it has the exact same name and settings. Each ID generates a separate report. If you see two reports for what appears to be the same survey, it is because a duplicate was created at some point.
Billing / Usage Report
Under the Billing tab, workspace admins can access a usage report that shows consumption data, including tokens used, WhatsApp templates sent, AI voice conversations, and other billing-related metrics. This report is not configurable; you simply select a time period and download it.
Note:The billing report always sends as an email attachment and cannot be configured to send as a link. All other reports under the main Reports screen can be set to send as a link instead.
Running a Report
When you run any report, the output is emailed to the address associated with your account.
- If the report file is under 20 MB, it will be sent as an email attachment.
- If the report file is over 20 MB, it will be sent as a download link instead.
If your organisation has email security policies that block attachments, we can configure your account to always send reports as links rather than attachments. This is not something you can toggle yourself. Please reach out to your Glassix contact or implementation partner to request this change.
Multi-Department Reports
You can add departments to a report to pull data from multiple departments at once. There are two important limitations to be aware of:
Important:You cannot combine departments from different time zones. If you attempt to do so, you will receive an error. Make sure all selected departments share the same time zone.
Note:When you run a report across multiple departments, you will receive separate data per department not a single combined dataset.
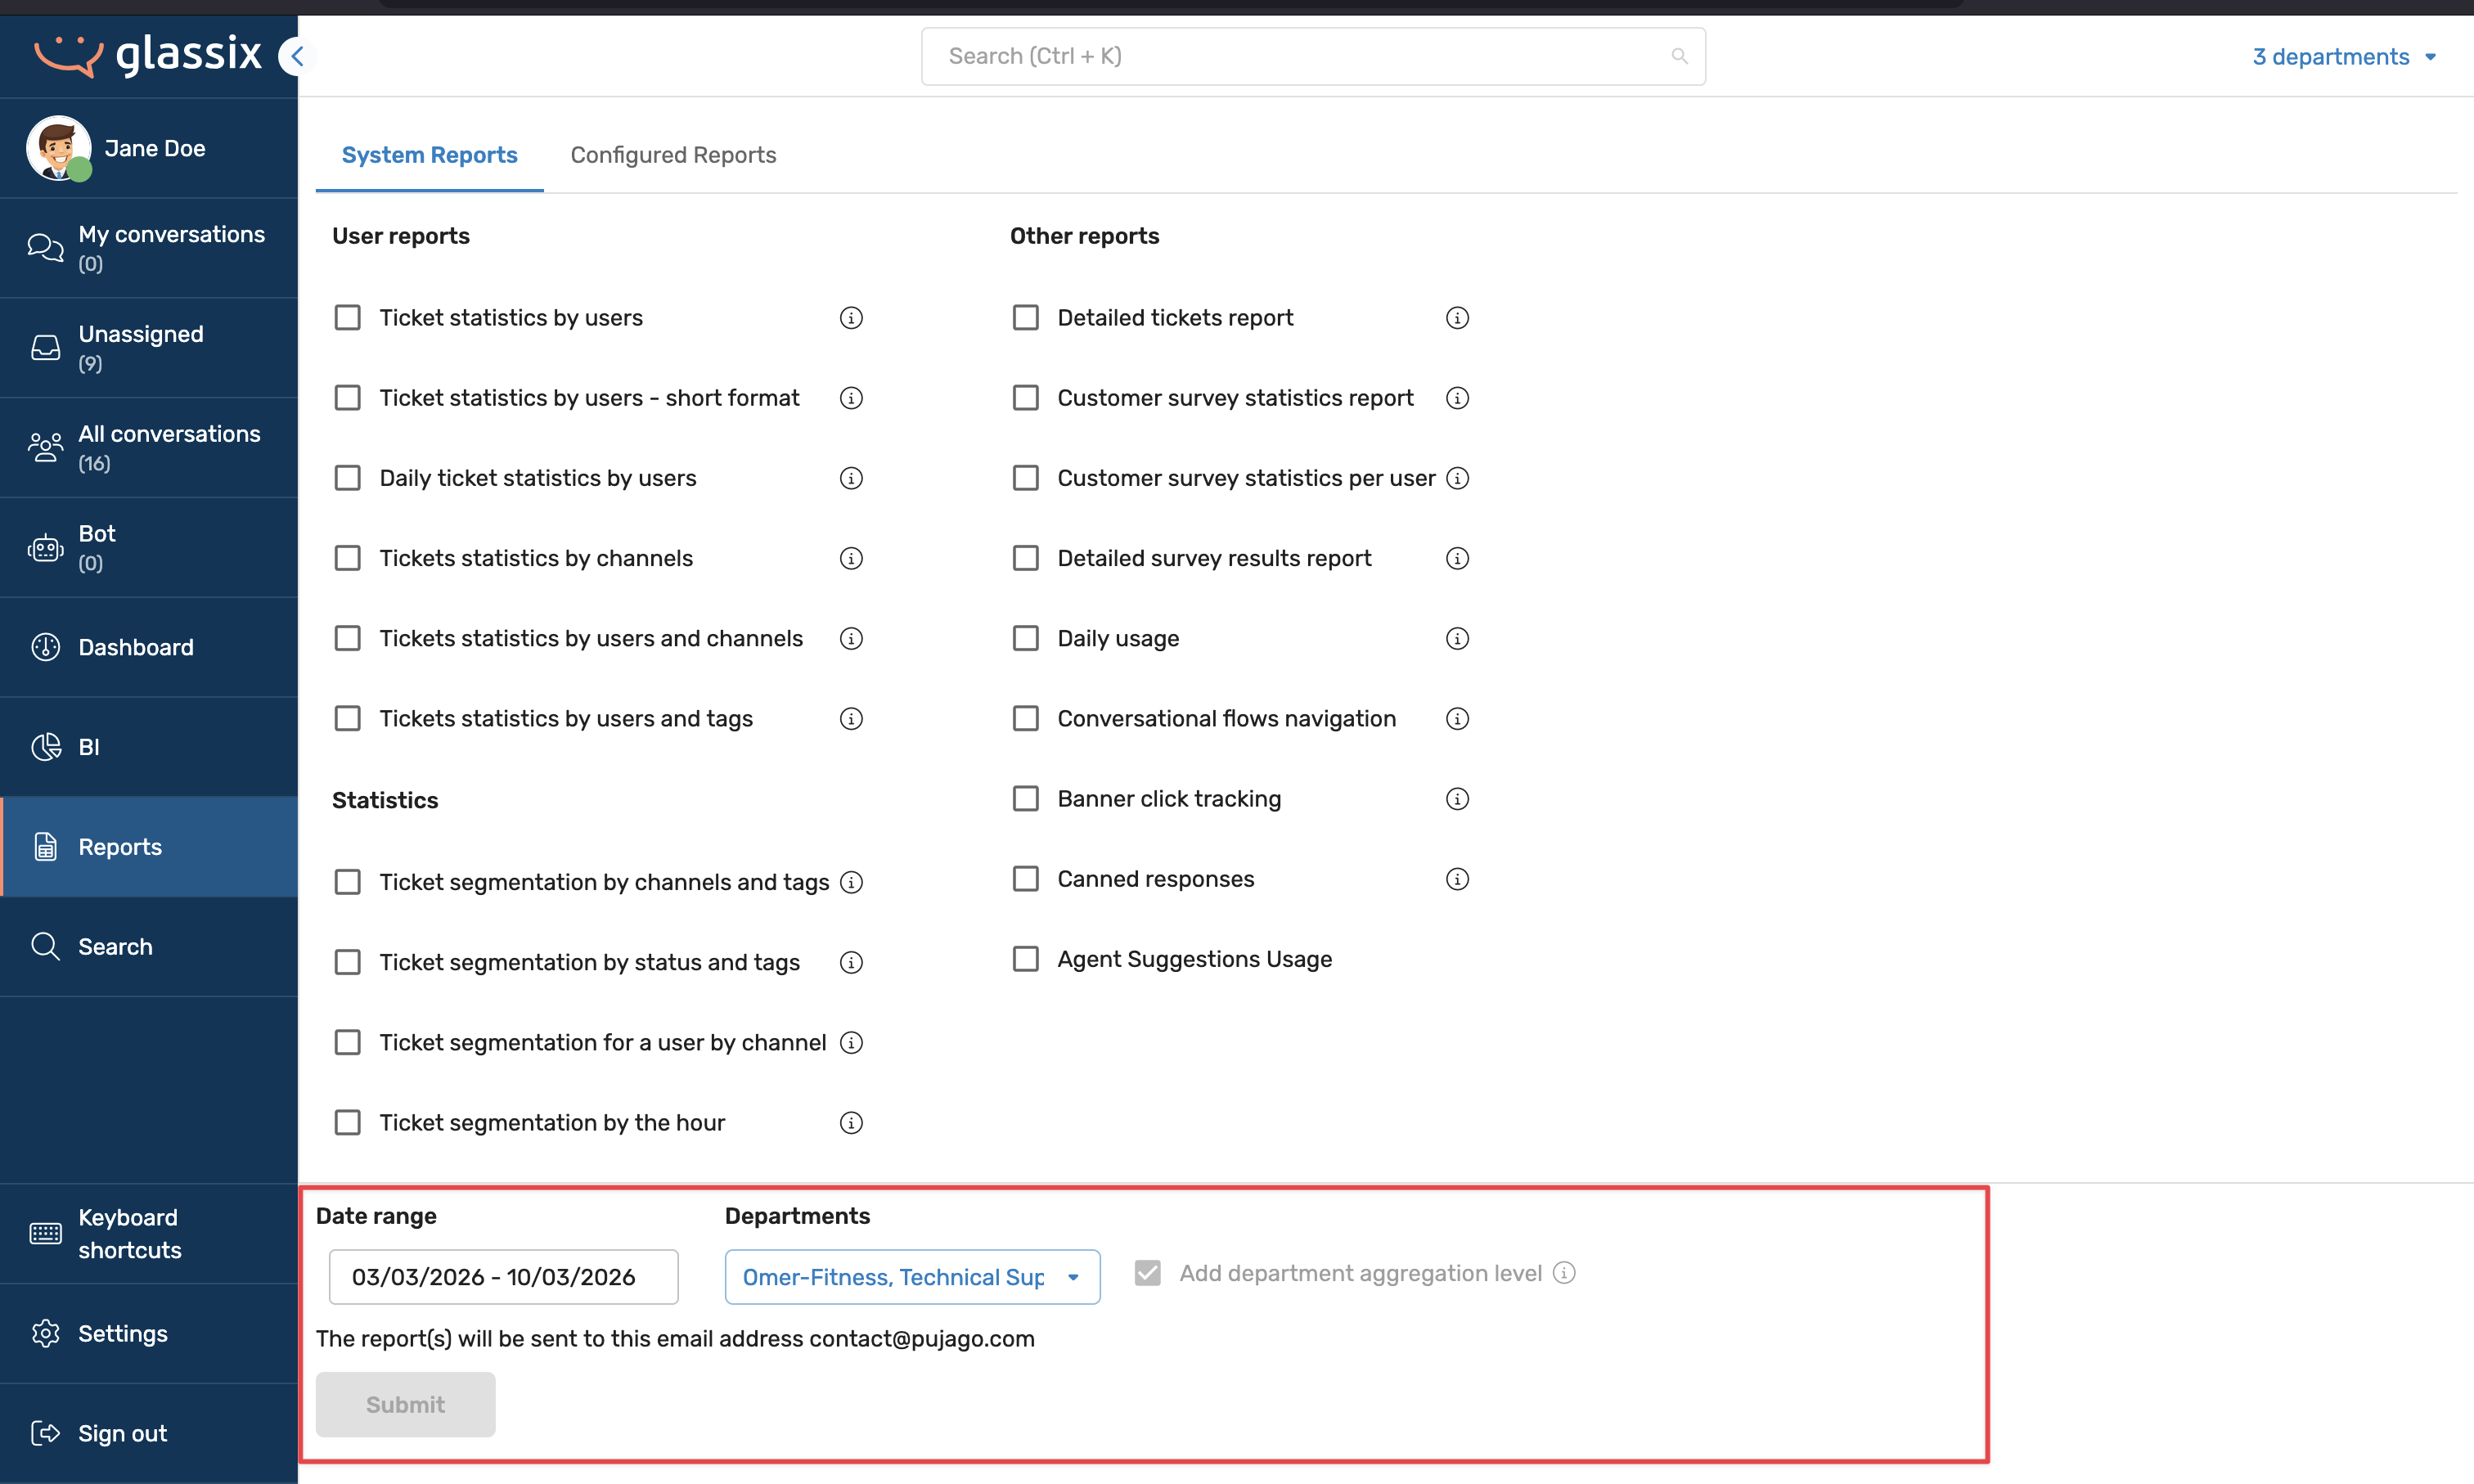
Department Aggregation Level
If you want combined totals across departments, select the Department Aggregation level when running the report. This adds a combined column alongside the per-department columns. For example, if you are running a report on ticket statistics by channel, you would see WhatsApp (Department A), WhatsApp (Department B), and WhatsApp (Combined).
Note that department aggregation is not available for all reports. Survey reports, for instance, do not support aggregation because surveys are tied to a specific department, and the same survey across two departments will always have different IDs.
Info:You can run a maximum of three reports at a time.
Configuring Reports (Removing Fields)
Every system report and every custom report can be trimmed by removing fields you don't need. To do this, open any report, deselect the fields you want to remove, and click Save. The modified report will be saved under My Reports.
From My Reports, you can also share a configured report with your department, making it available to other admins and team leaders.
Note:You can remove fields from reports, but you cannot add fields that aren't already included in the base report.
Custom Reports
Custom reports allow you to upload your own Excel template that will be automatically populated with report data when you run it. This is useful if you want to include pre-built pivot tables, formulas, graphs, or other calculations so that when you download your report, all of your analysis is already done for you.
What Custom Reports Can and Cannot Do
Custom reports are based on the Detailed Tickets report, which provides the most data fields. You cannot pull different data fields from the database than what is already included in the Detailed Tickets report. What you can do is:
- Add your own sheets with pivot tables, formulas, graphs, and calculations
- Format and structure the data the way you want it
- Automate repetitive analysis so you don't have to copy and paste data each time
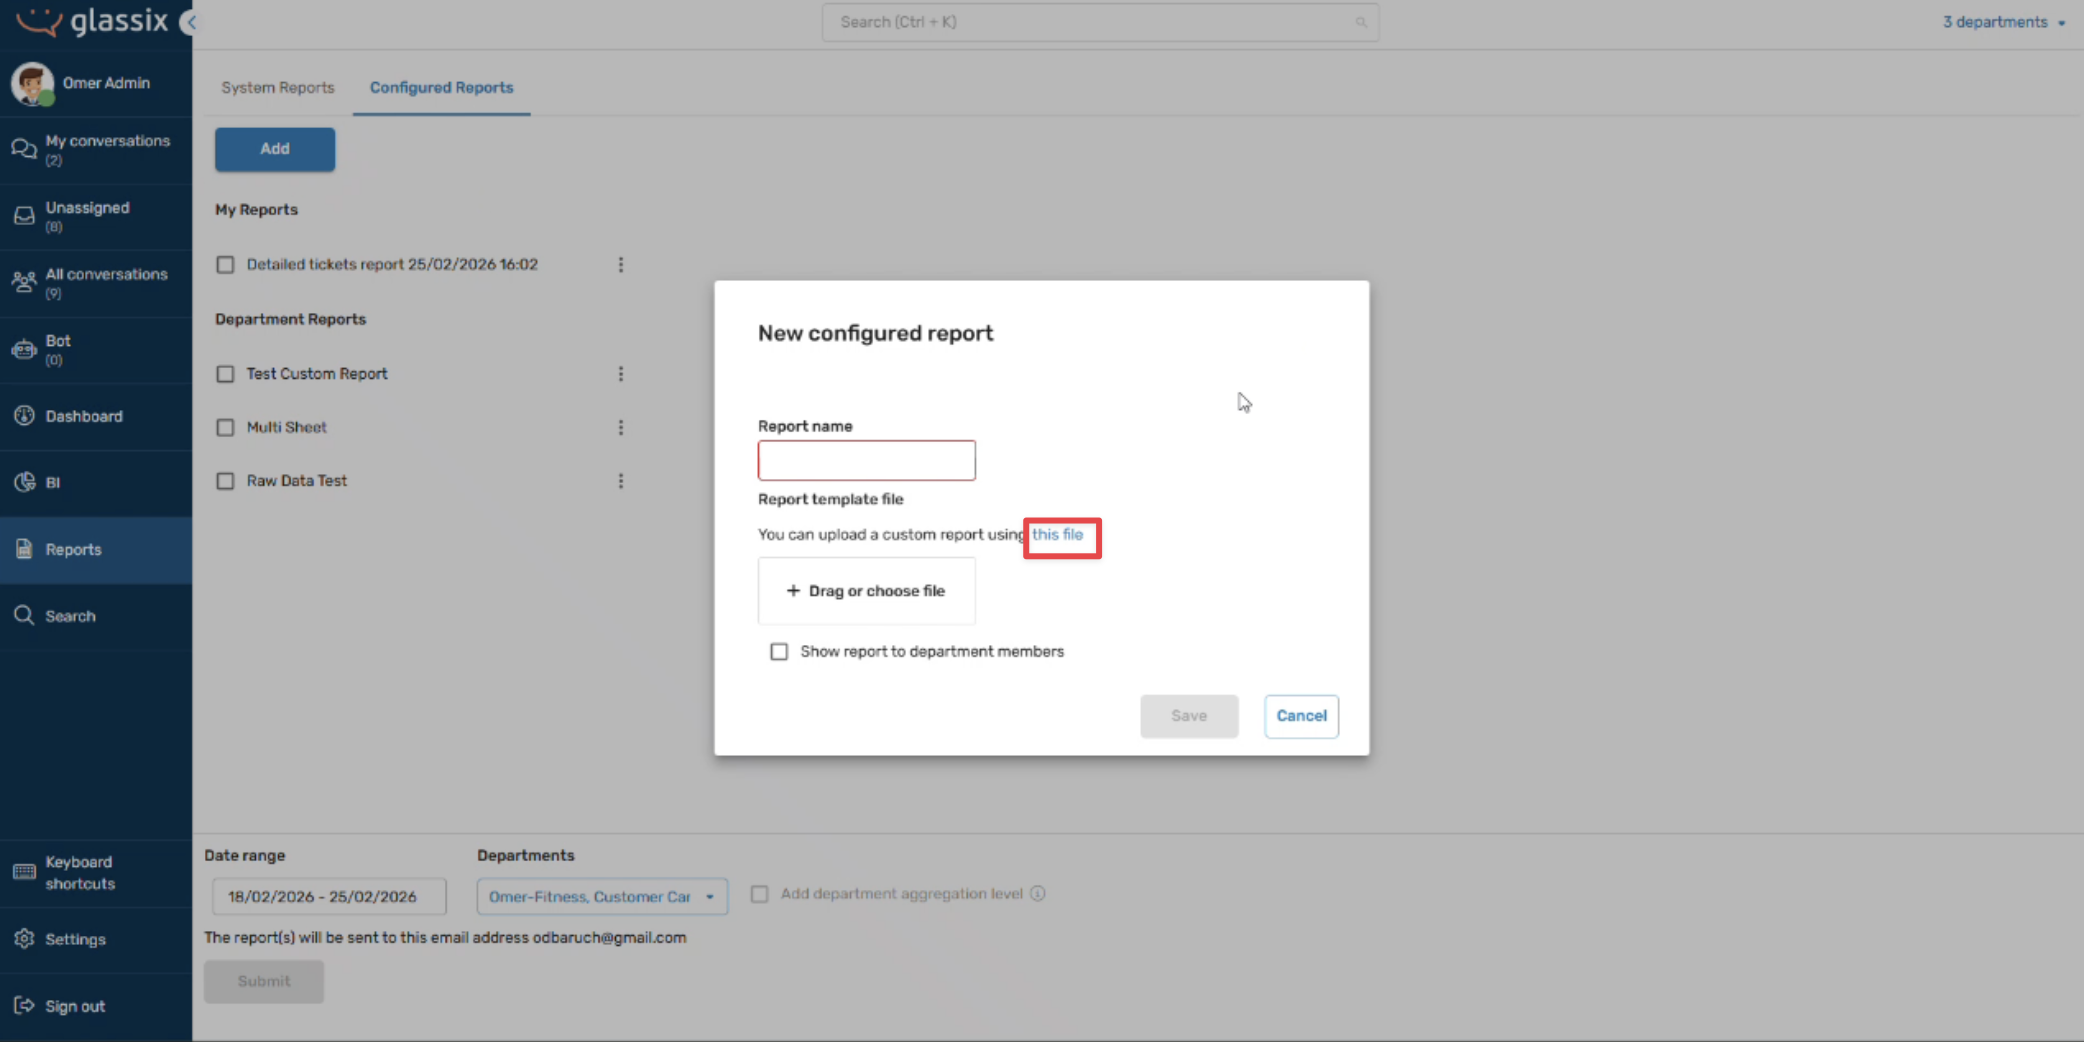
How to Create a Custom Report
-
Download the custom template from the new configured report modal.
-
Open the template. You will see a Raw Data sheet and some example sheets (such as Users and Channels).
-
The example sheets (Users, Channels, Teams, etc.) are for reference only. You can delete them.
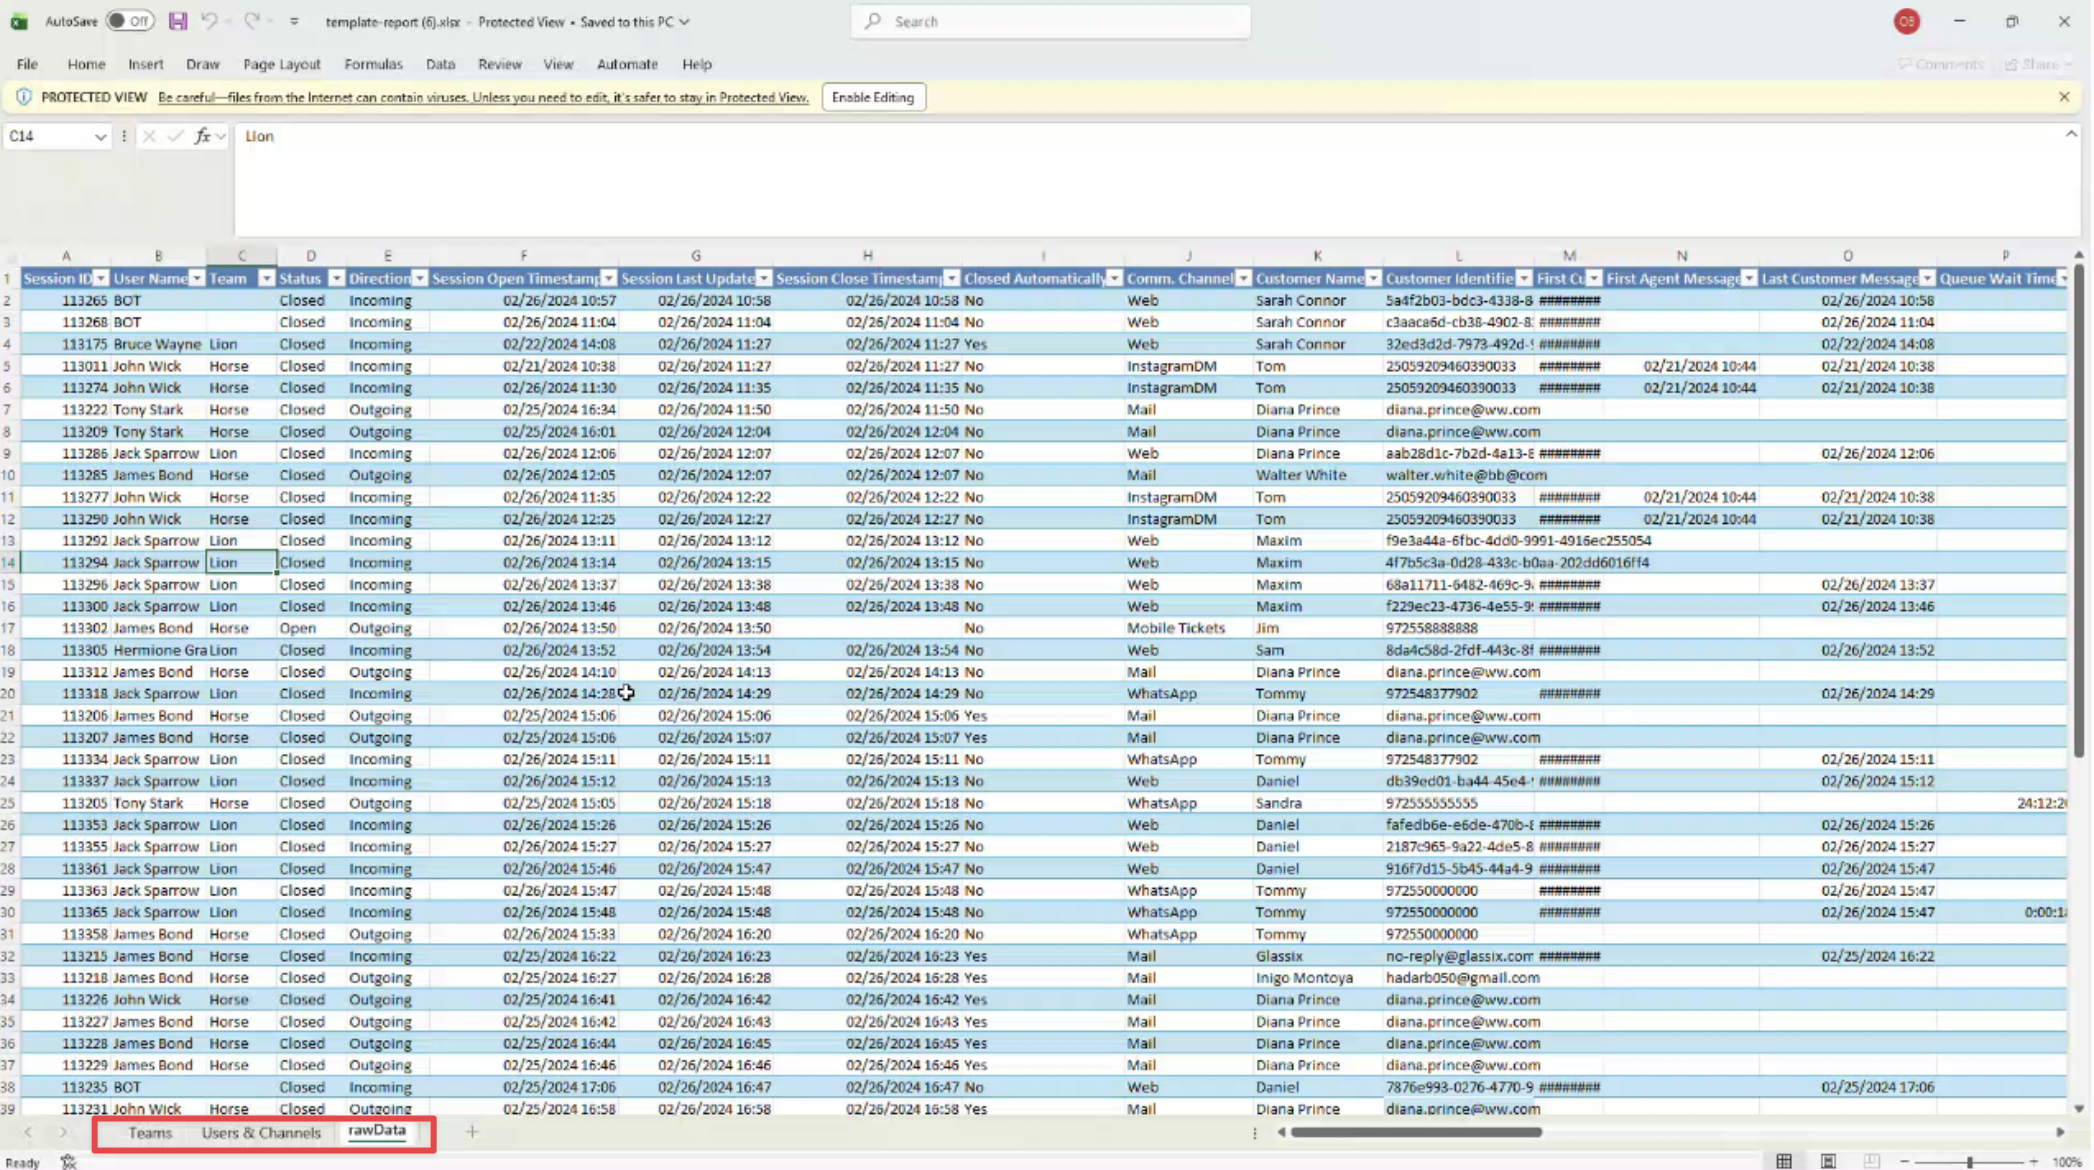
-
Note:The Raw Data sheet must always remain the last sheet in the workbook. Do not delete it, rename it, or modify the data on it. This sheet contains example data that our system uses to format the report correctly it is required for the process to work.
-
Add your own sheets with whatever pivot tables, calculations, or formatting you need.
-
Save the file and upload it via the new configured report modal. Give your report a name.
-
Whenever you run that custom report going forward, the Raw Data sheet will be automatically populated with live data, and all of your calculations and pivot tables will update accordingly.
Scheduled Reports
Scheduled reports are not visible in the interface; they must be requested through your Glassix contact or implementation partner. This applies to both built-in system reports and custom reports.
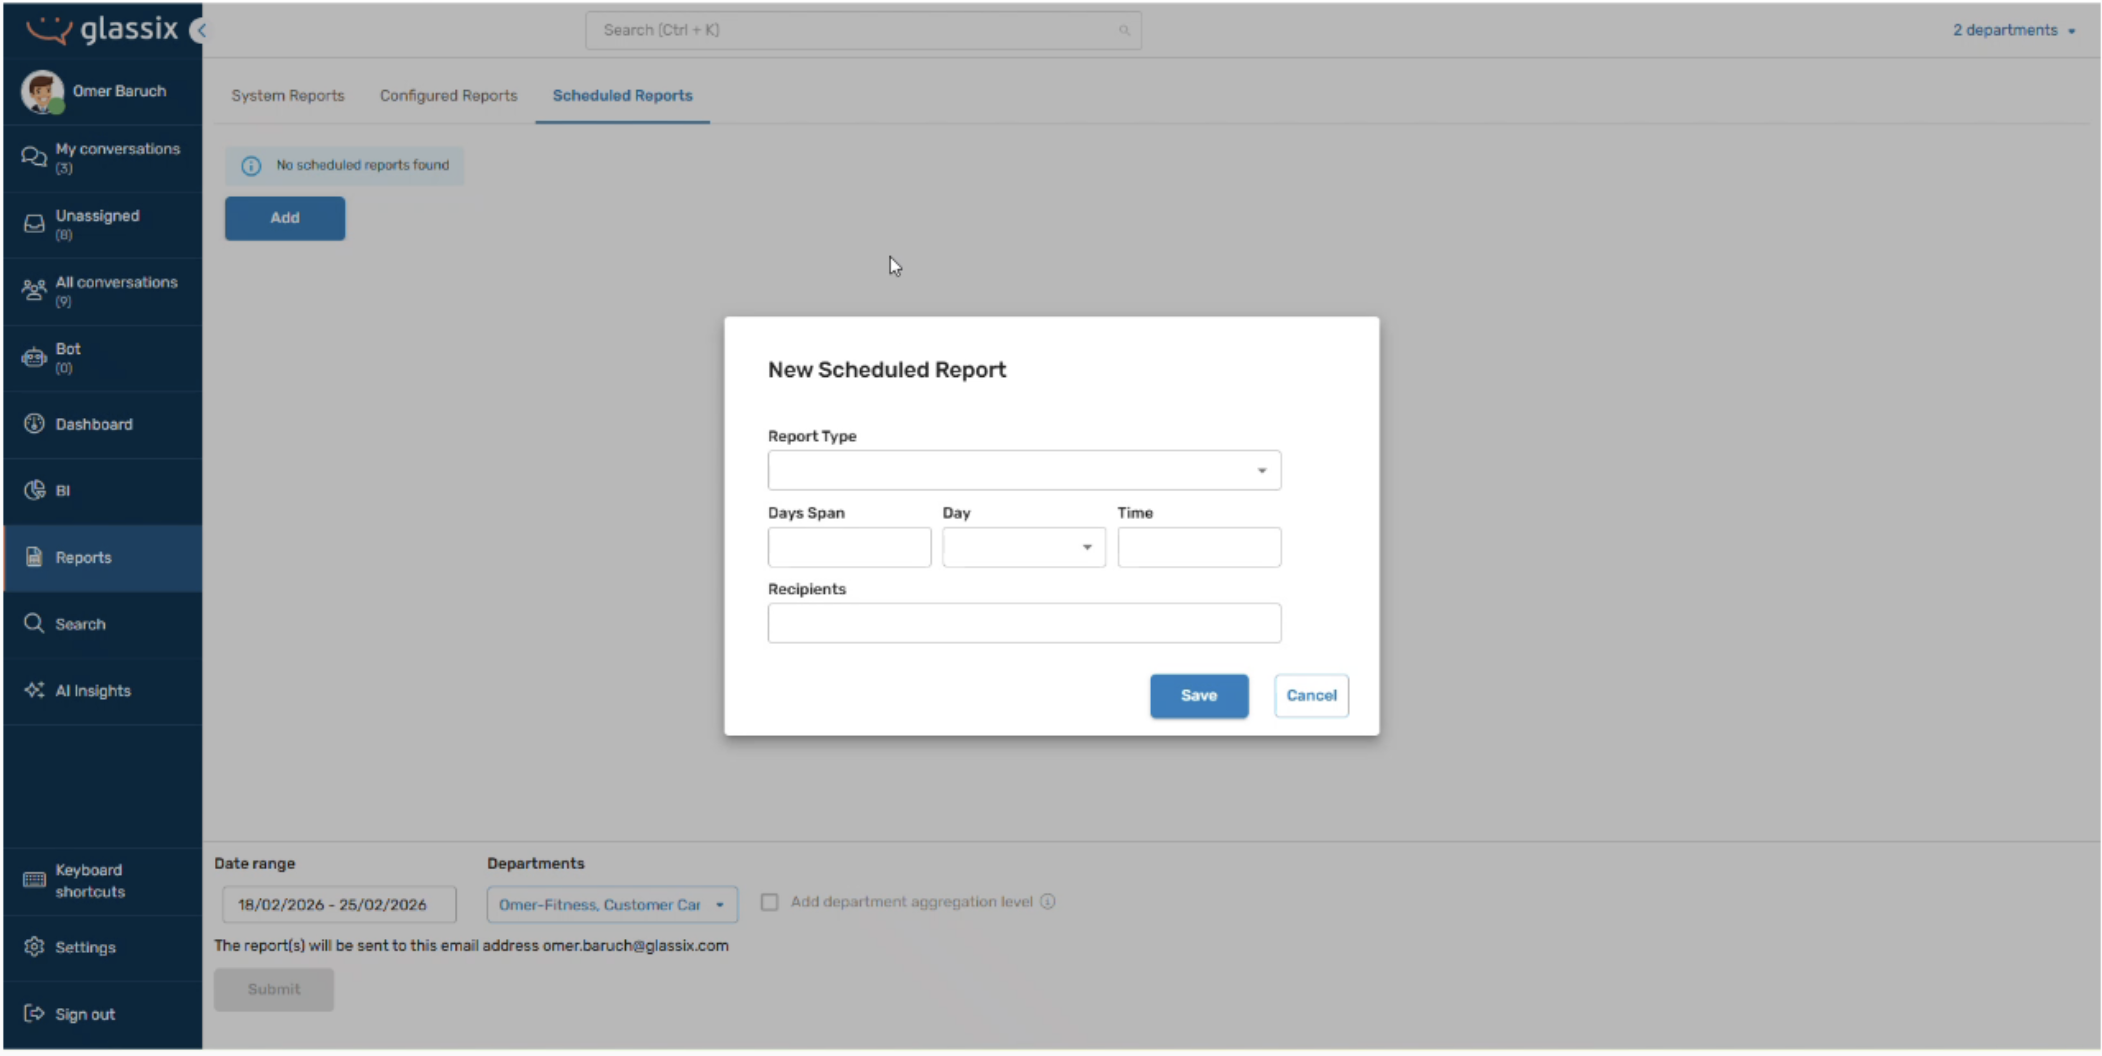
To set up a scheduled report, provide the following information when you reach out:
- Which report you want scheduled (system report or custom report name)
- How many days back the report should look (e.g., 1 day for a daily report, 7 days for a rolling weekly report)
- Frequency every day, or on a specific day of the week
- Time of day you want the report sent
- Email address The report should be delivered to
For example, if you want a report of today's data, you would request a 1-day span sent at 11:55 PM. The report will cover data from the previous day to 11:55 PM, and from the current 11:55 PM to the current 11:55 PM, which will generally reflect that day's activity.
A few things to keep in mind:
- There may be a limit on the number of scheduled reports you can have active at one time. Reach out to discuss your needs.
- Scheduled reports can be configured for both system and custom reports.
Important:If you delete a custom report that has a scheduled report attached, the scheduled report will stop sending and will be removed. If you need to make changes to a custom report with a schedule, use the Edit option rather than deleting and re-uploading it.
Updated 4 months ago