Add a New Custom Dashboard
Learn about detailed steps to add a new custom dashboard.
Prerequisites
Learn about dashboard basics here.
Overview
Info:Dashboard statistics are calculated for the current day only and resets every midnight based on your timezone.
This article provides a complete walkthrough for building a custom dashboard. This is available for admins and team leaders, such as shift managers, who need a clear, bird's-eye view of the team's performance without having to dig through multiple reports.
This guide walks through the full dashboard-building flow: adding widgets, arranging them, configuring thresholds and filters, and finalizing access settings.
Why Create a Custom Dashboard
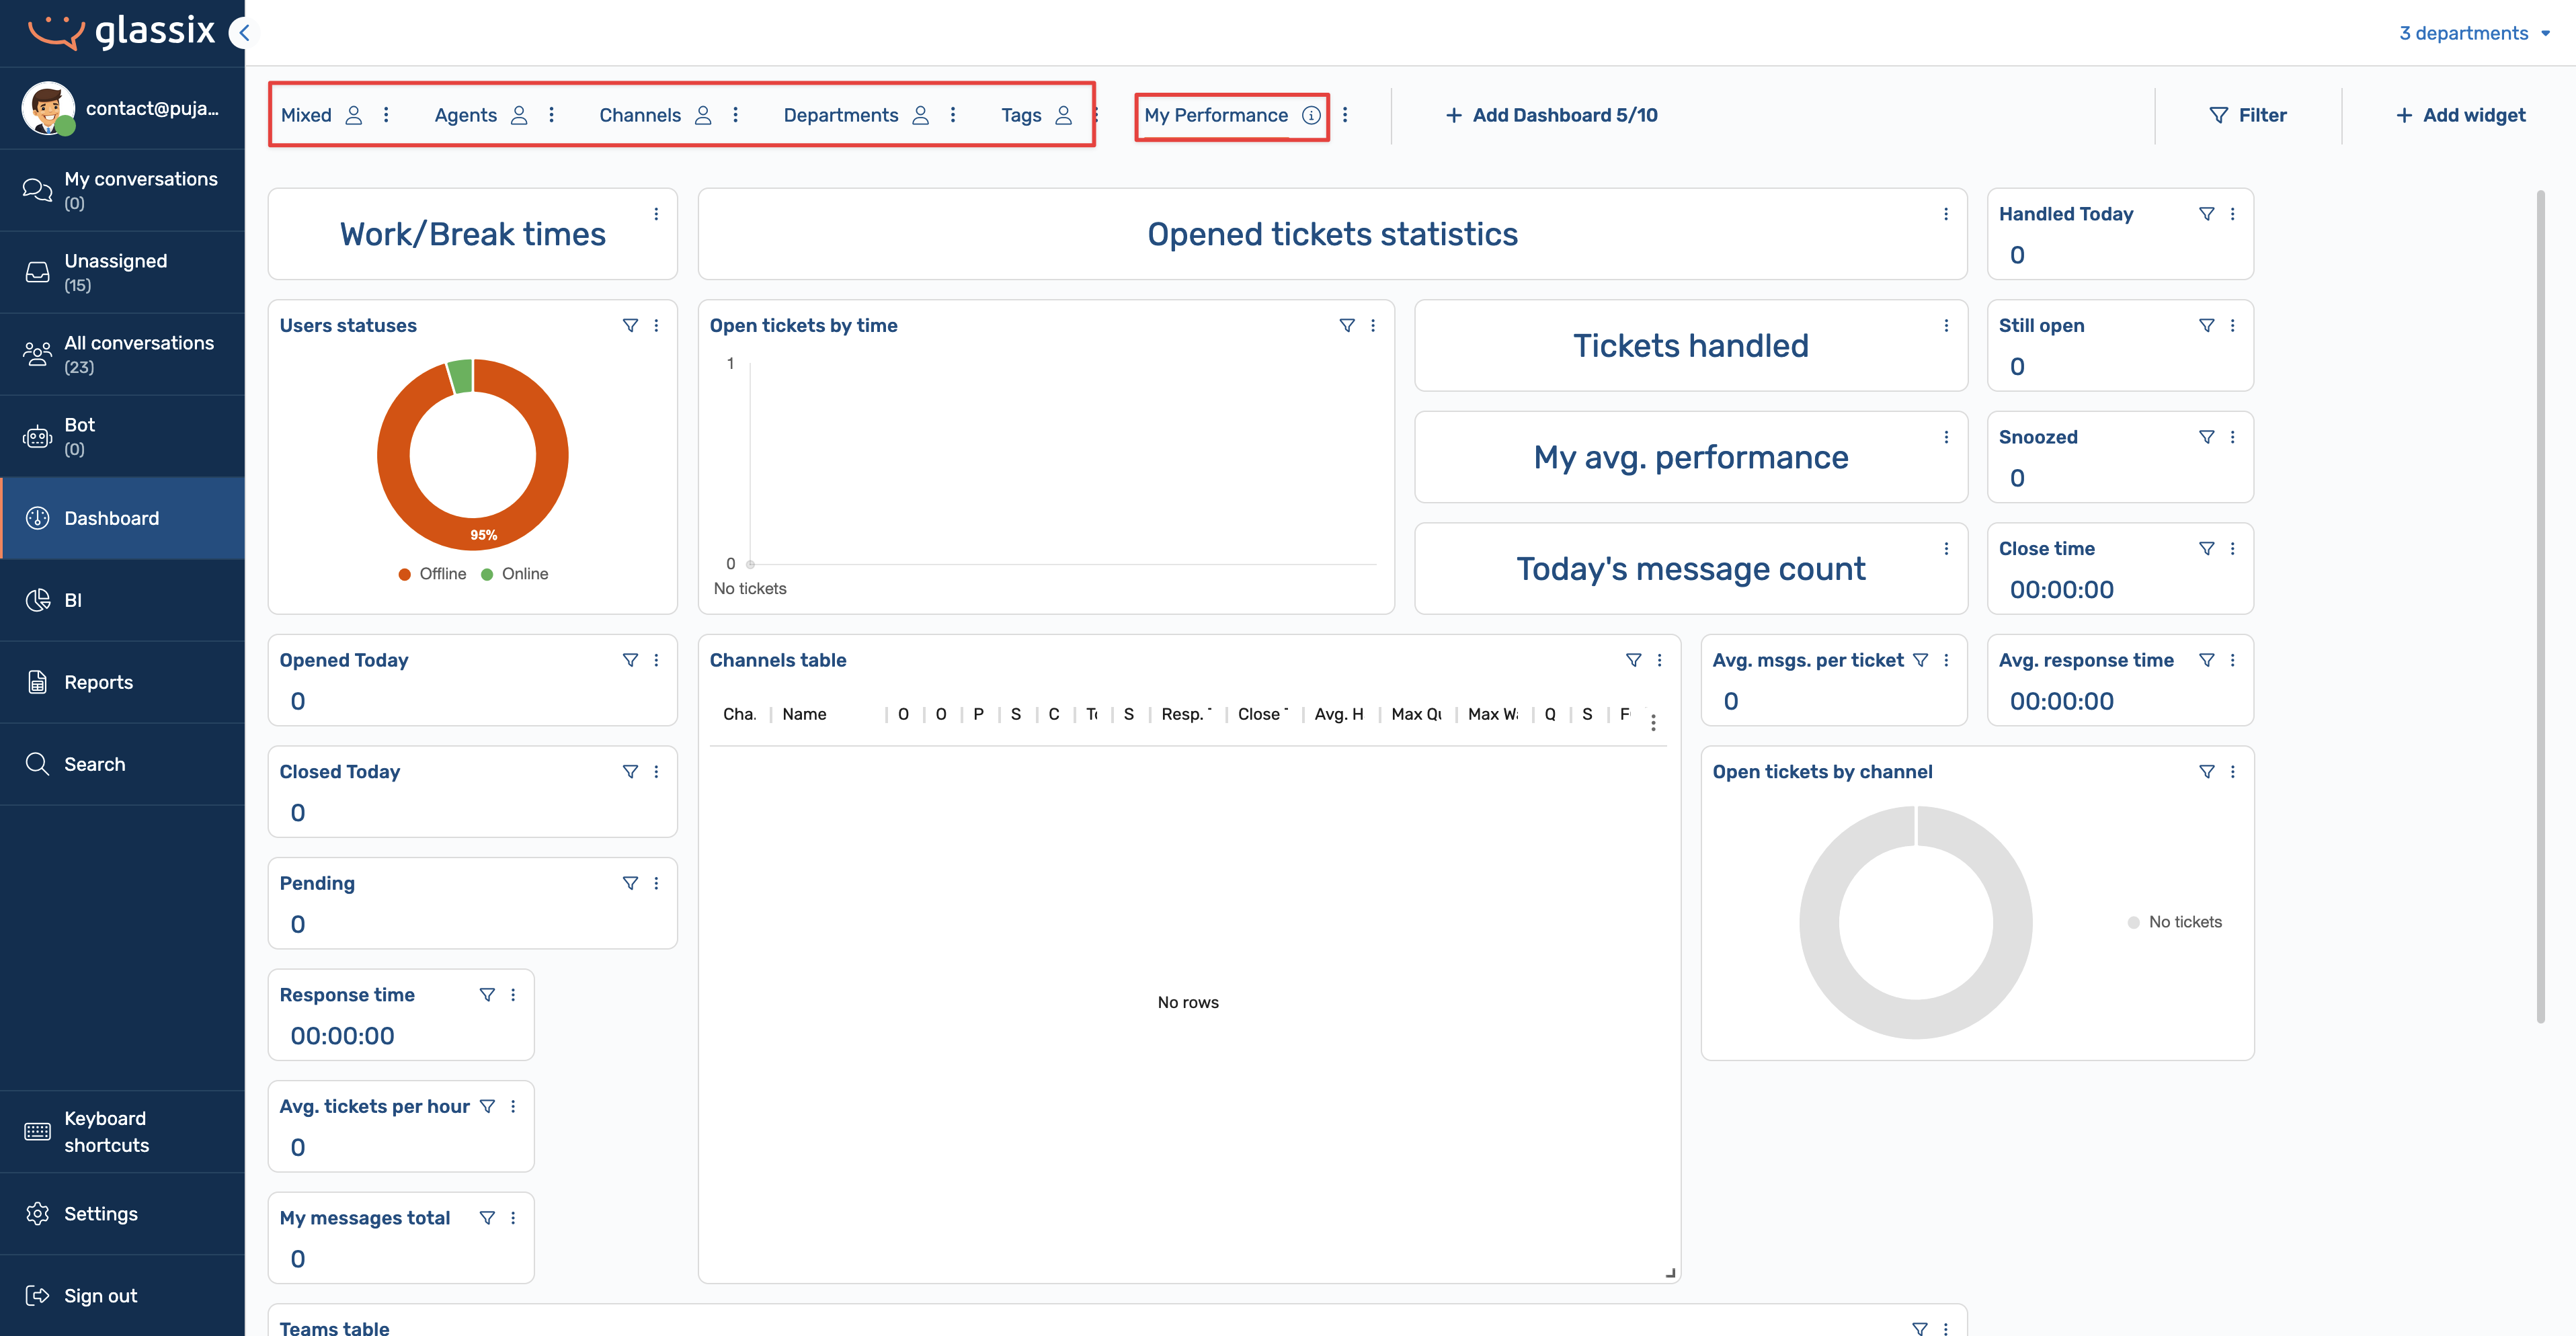
My performance dashboard is the default dashboard view for every Glassix user. This view focuses on individual performance and is generally not useful for admins or team leaders who need visibility into team-wide metrics.
While built-in dashboards (such as those for agents, tags, or channels) are helpful, most teams need a custom dashboard tailored to their specific workflow, for example, monitoring queue health, agent workload, or response times during a shift. That's when custom dashboards come in handy.
Creating a New Dashboard and Adding Widgets
Learn how to add a new dashboard and widgets to it here.
A few things to note:
- Before adding new widgets, take a moment to review what’s already on the dashboard. Remove any tiles or tables that aren’t relevant to your use case.
- You can select multiple widgets at once, then click Add. Newly added widgets are placed at the bottom of the dashboard.
- Icons indicate the type of widget you’re adding:
- Table icons represent detailed, multi-row data views (for example, agent performance tables).
- Tile icons represent single metrics or summary statistics (such as queued tickets or open tickets).
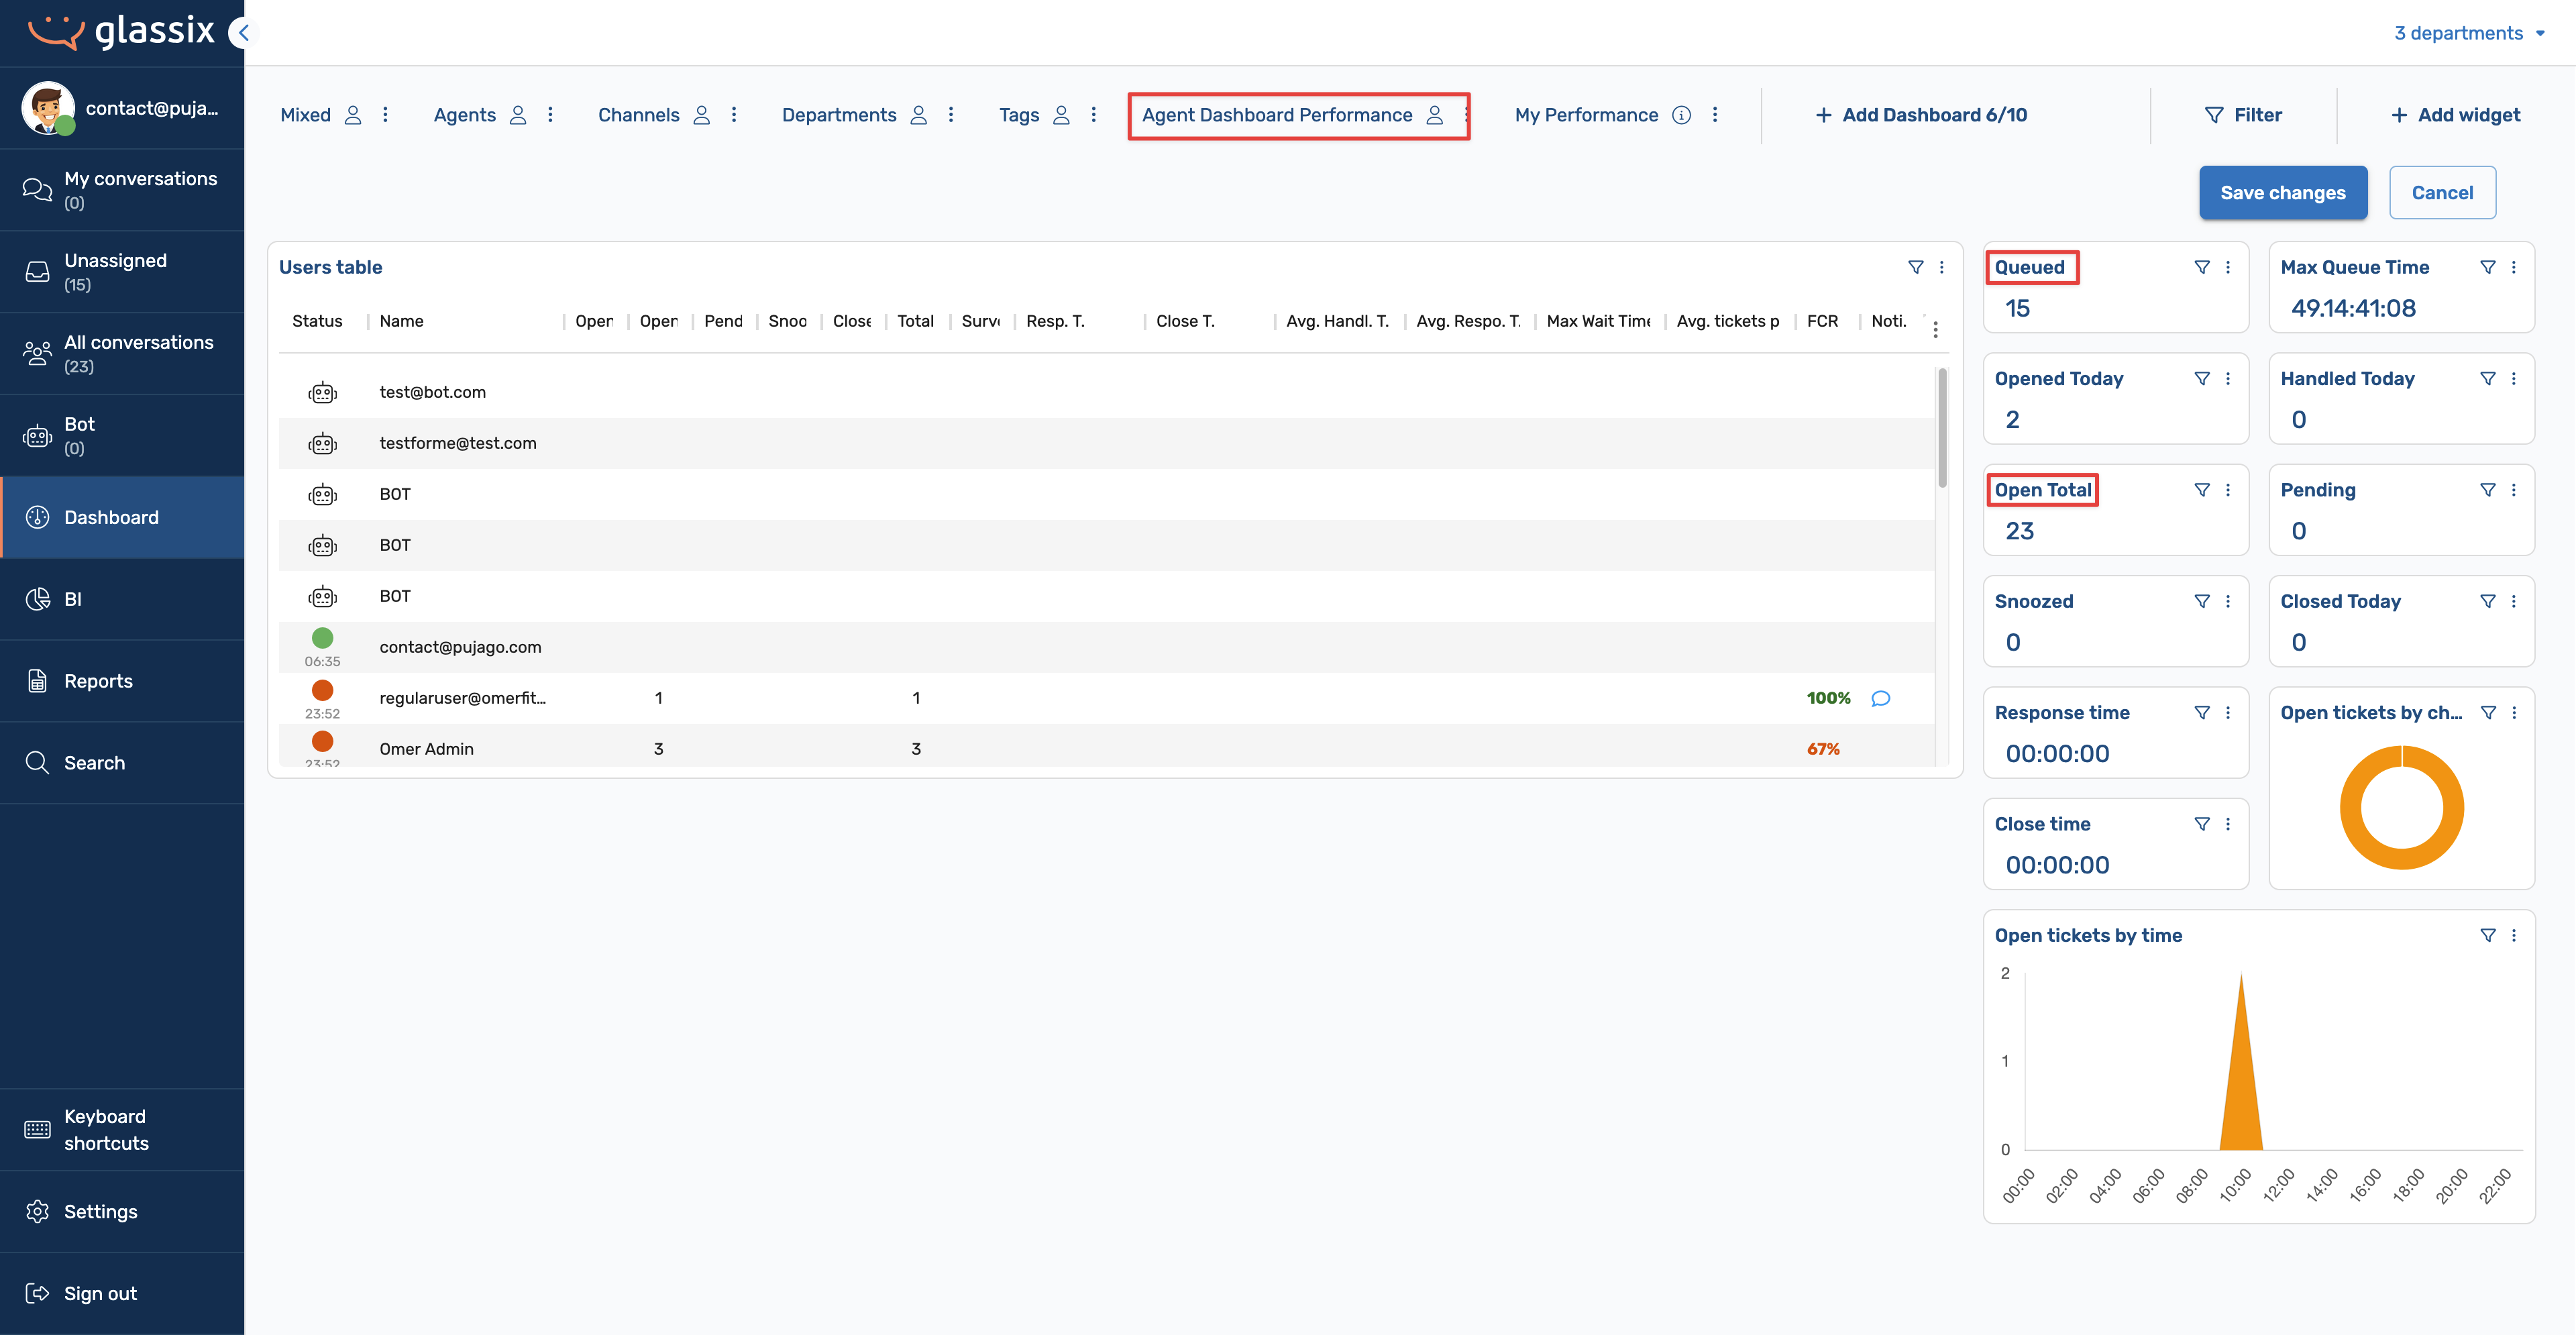
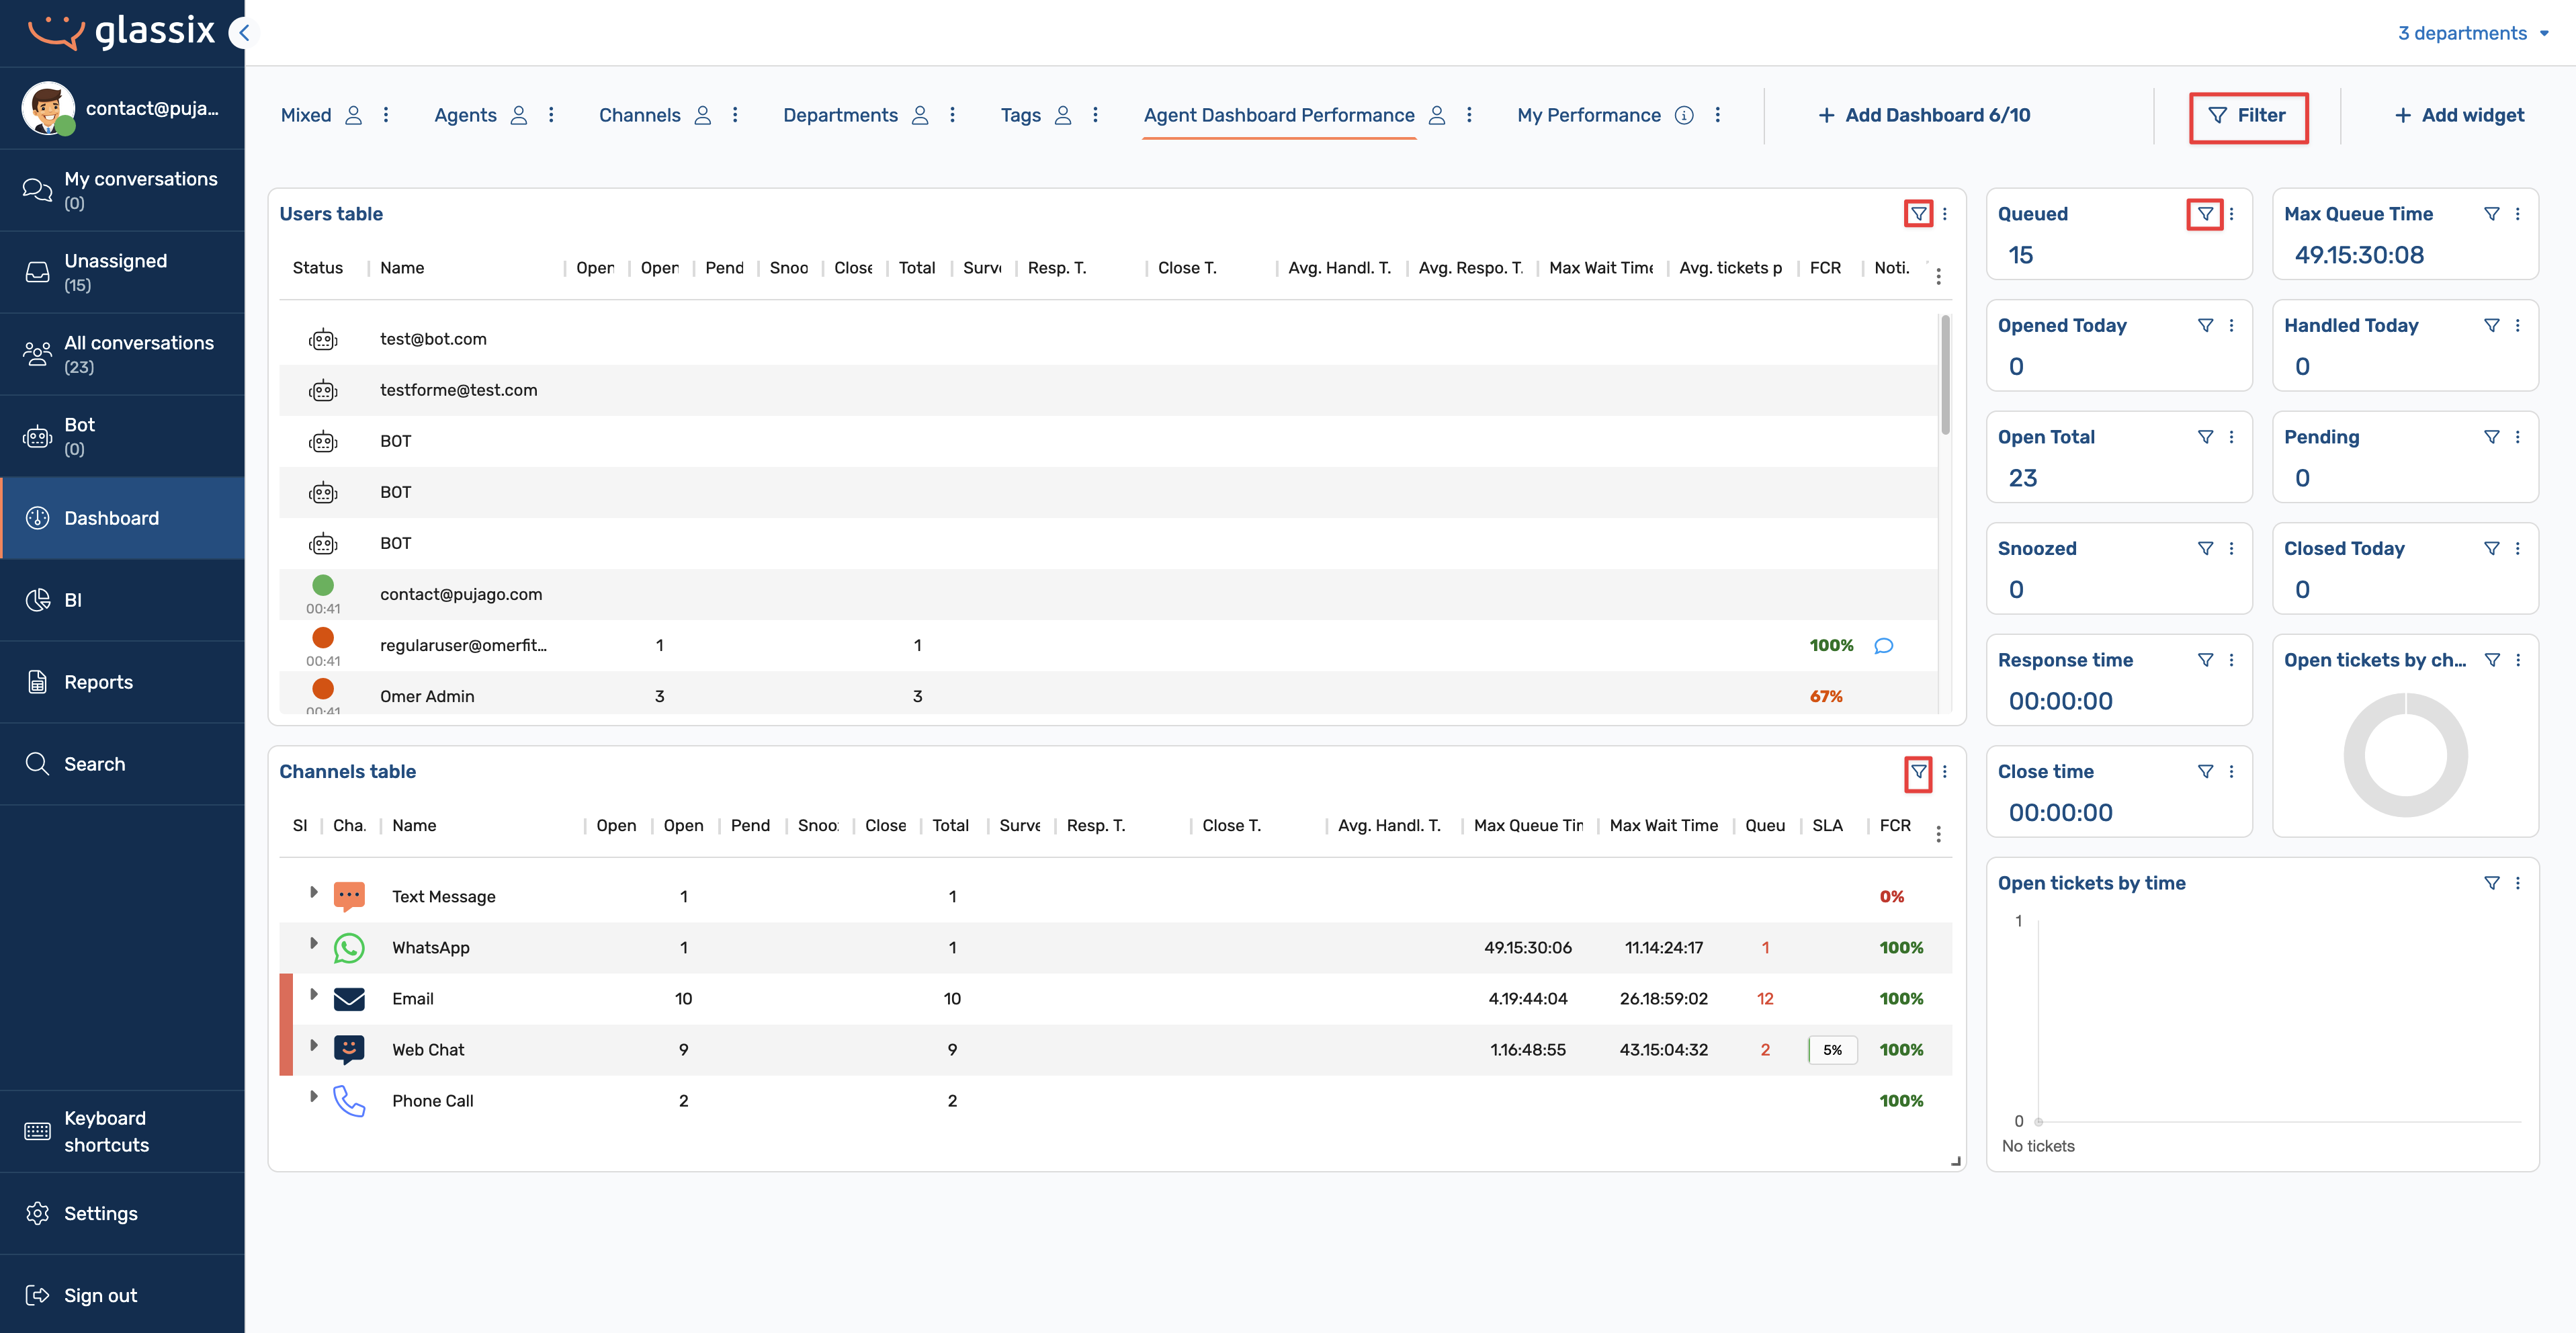
Example: Building an Agent Performance Dashboard
For a typical agent performance dashboard, you might:
- Add a main table showing agent-level metrics (such as queued, open, or awaiting-response tickets).
- Add several tiles highlighting critical real-time stats, such as queued tickets or total open tickets.
Tip:It’s best to limit your dashboard to one table whenever possible. Tables can contain many rows, due to large amount of data and using multiple tables can make the dashboard difficult to scan.
Arrange and Resize Widgets
Once widgets are added, you can organize them visually:
- Drag and drop widgets to rearrange their order.
- The dashboard automatically adjusts surrounding widgets as you move or resize items.
Configuring Thresholds
Thresholds define ranges that change the color of a statistic when specific values are reached. The threshold interface can change dynamically as you edit it. To avoid confusion, always add all the thresholds first, before setting values or colors.
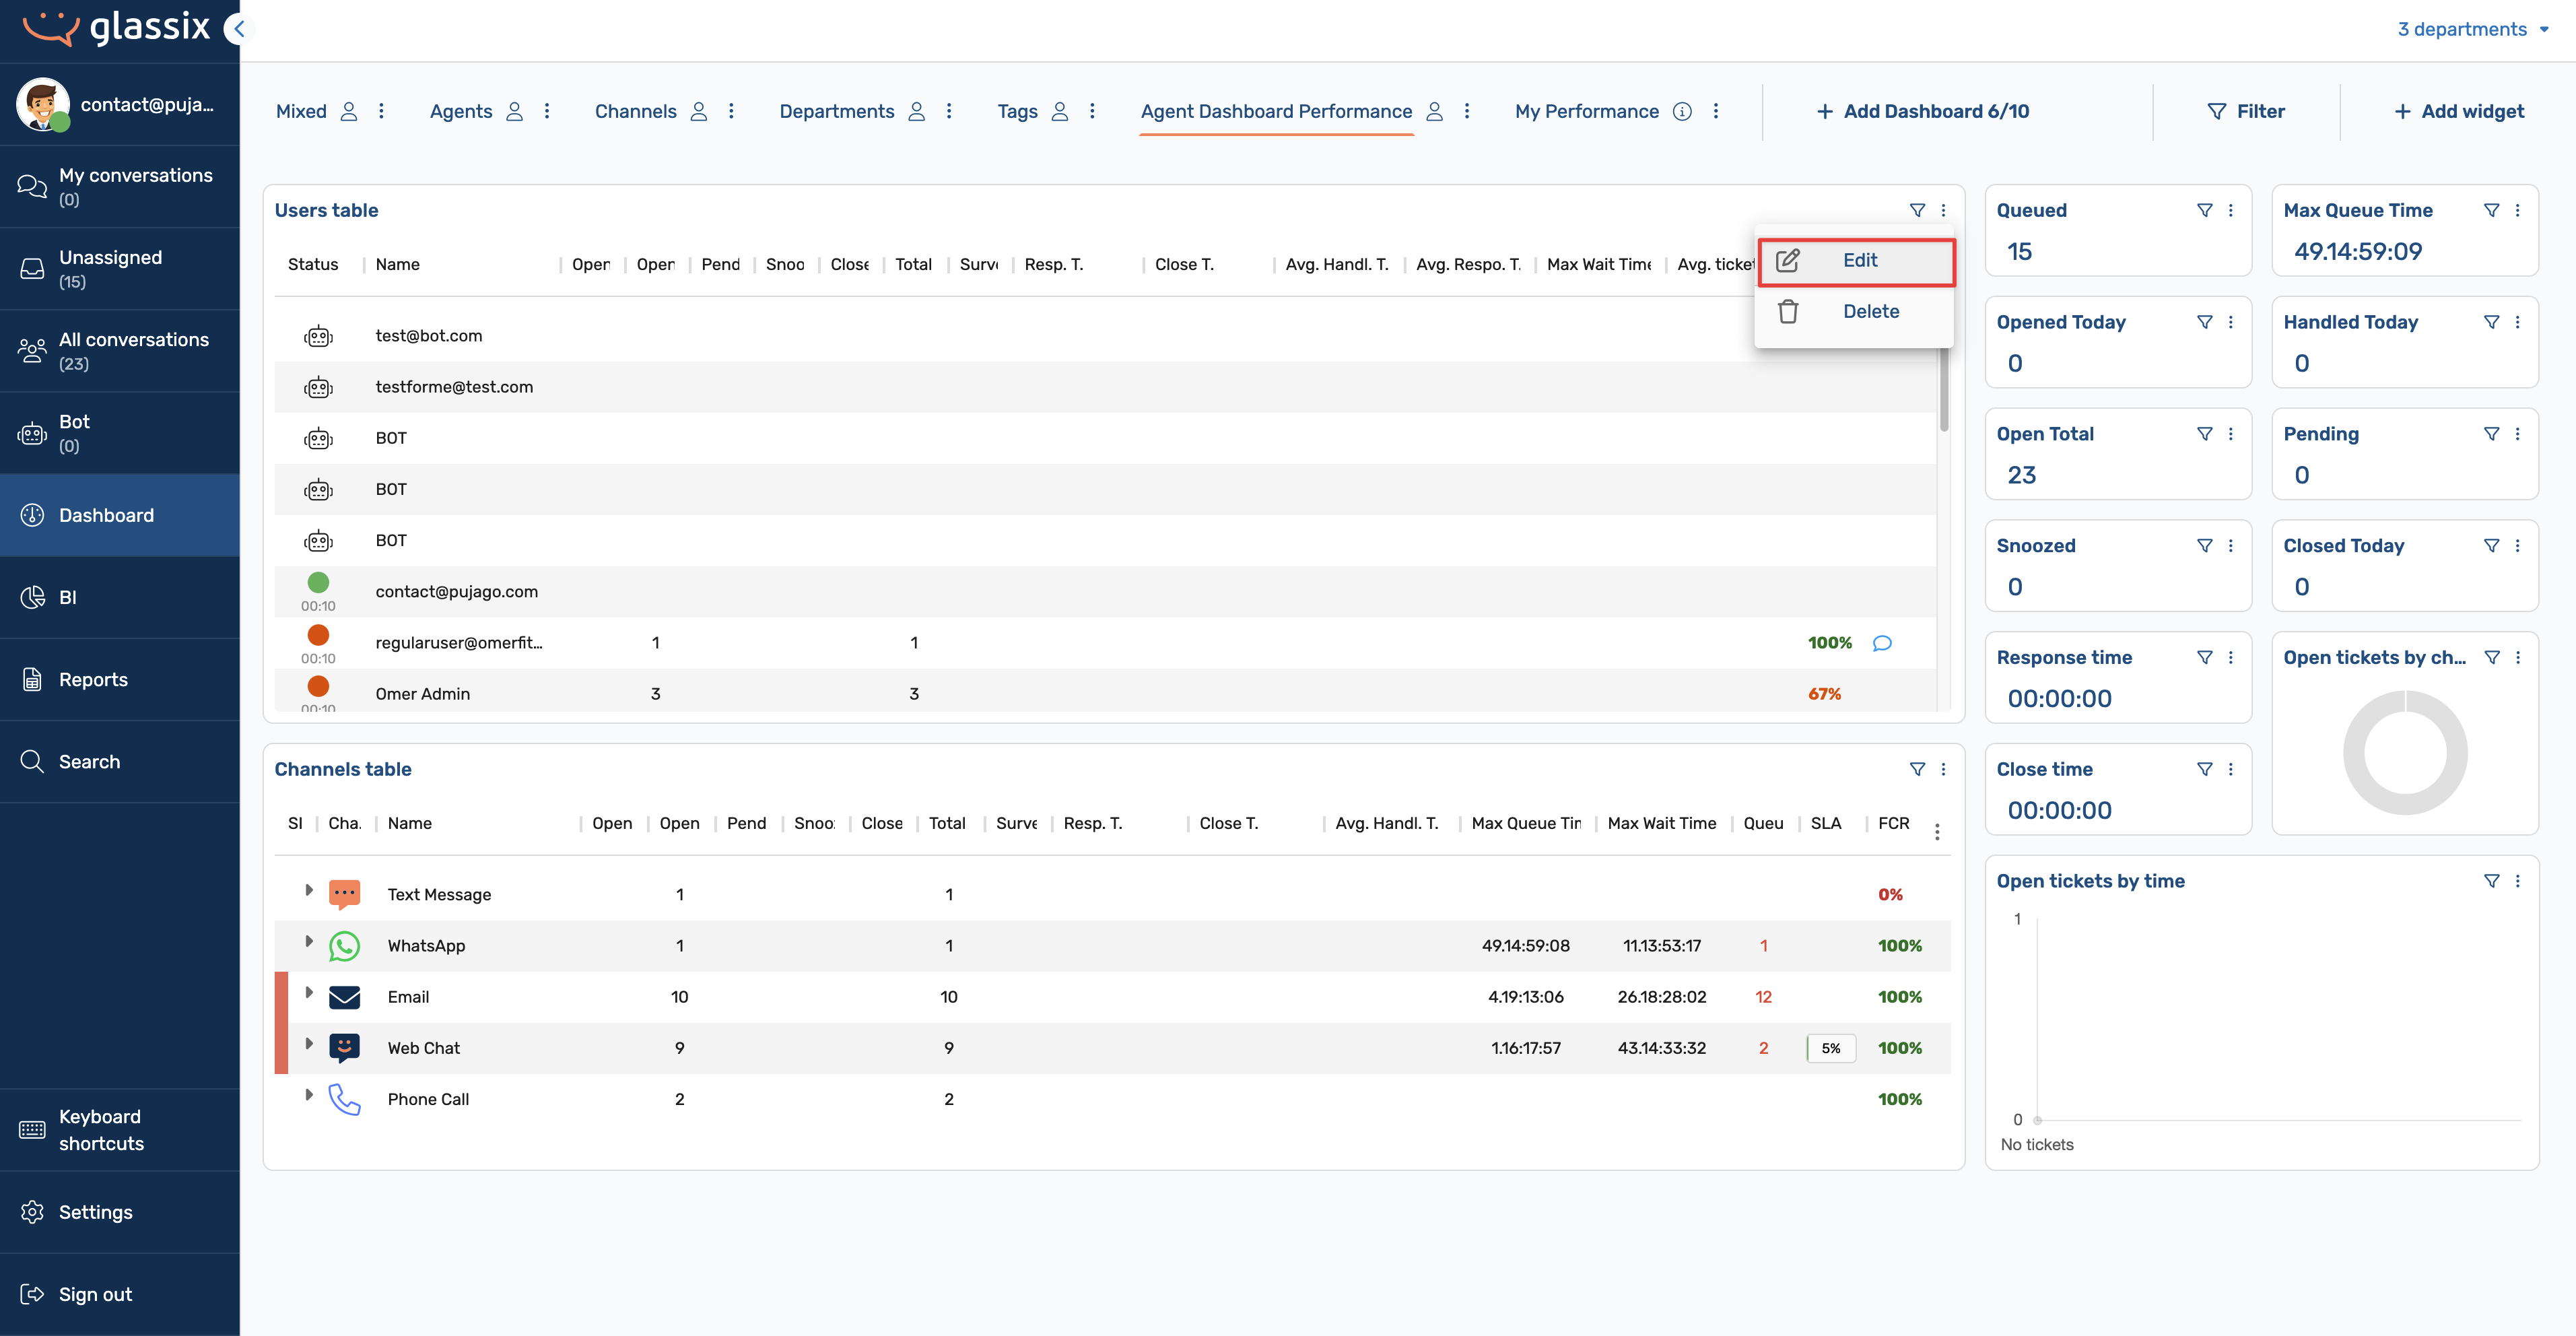
Adding Thresholds to Tables
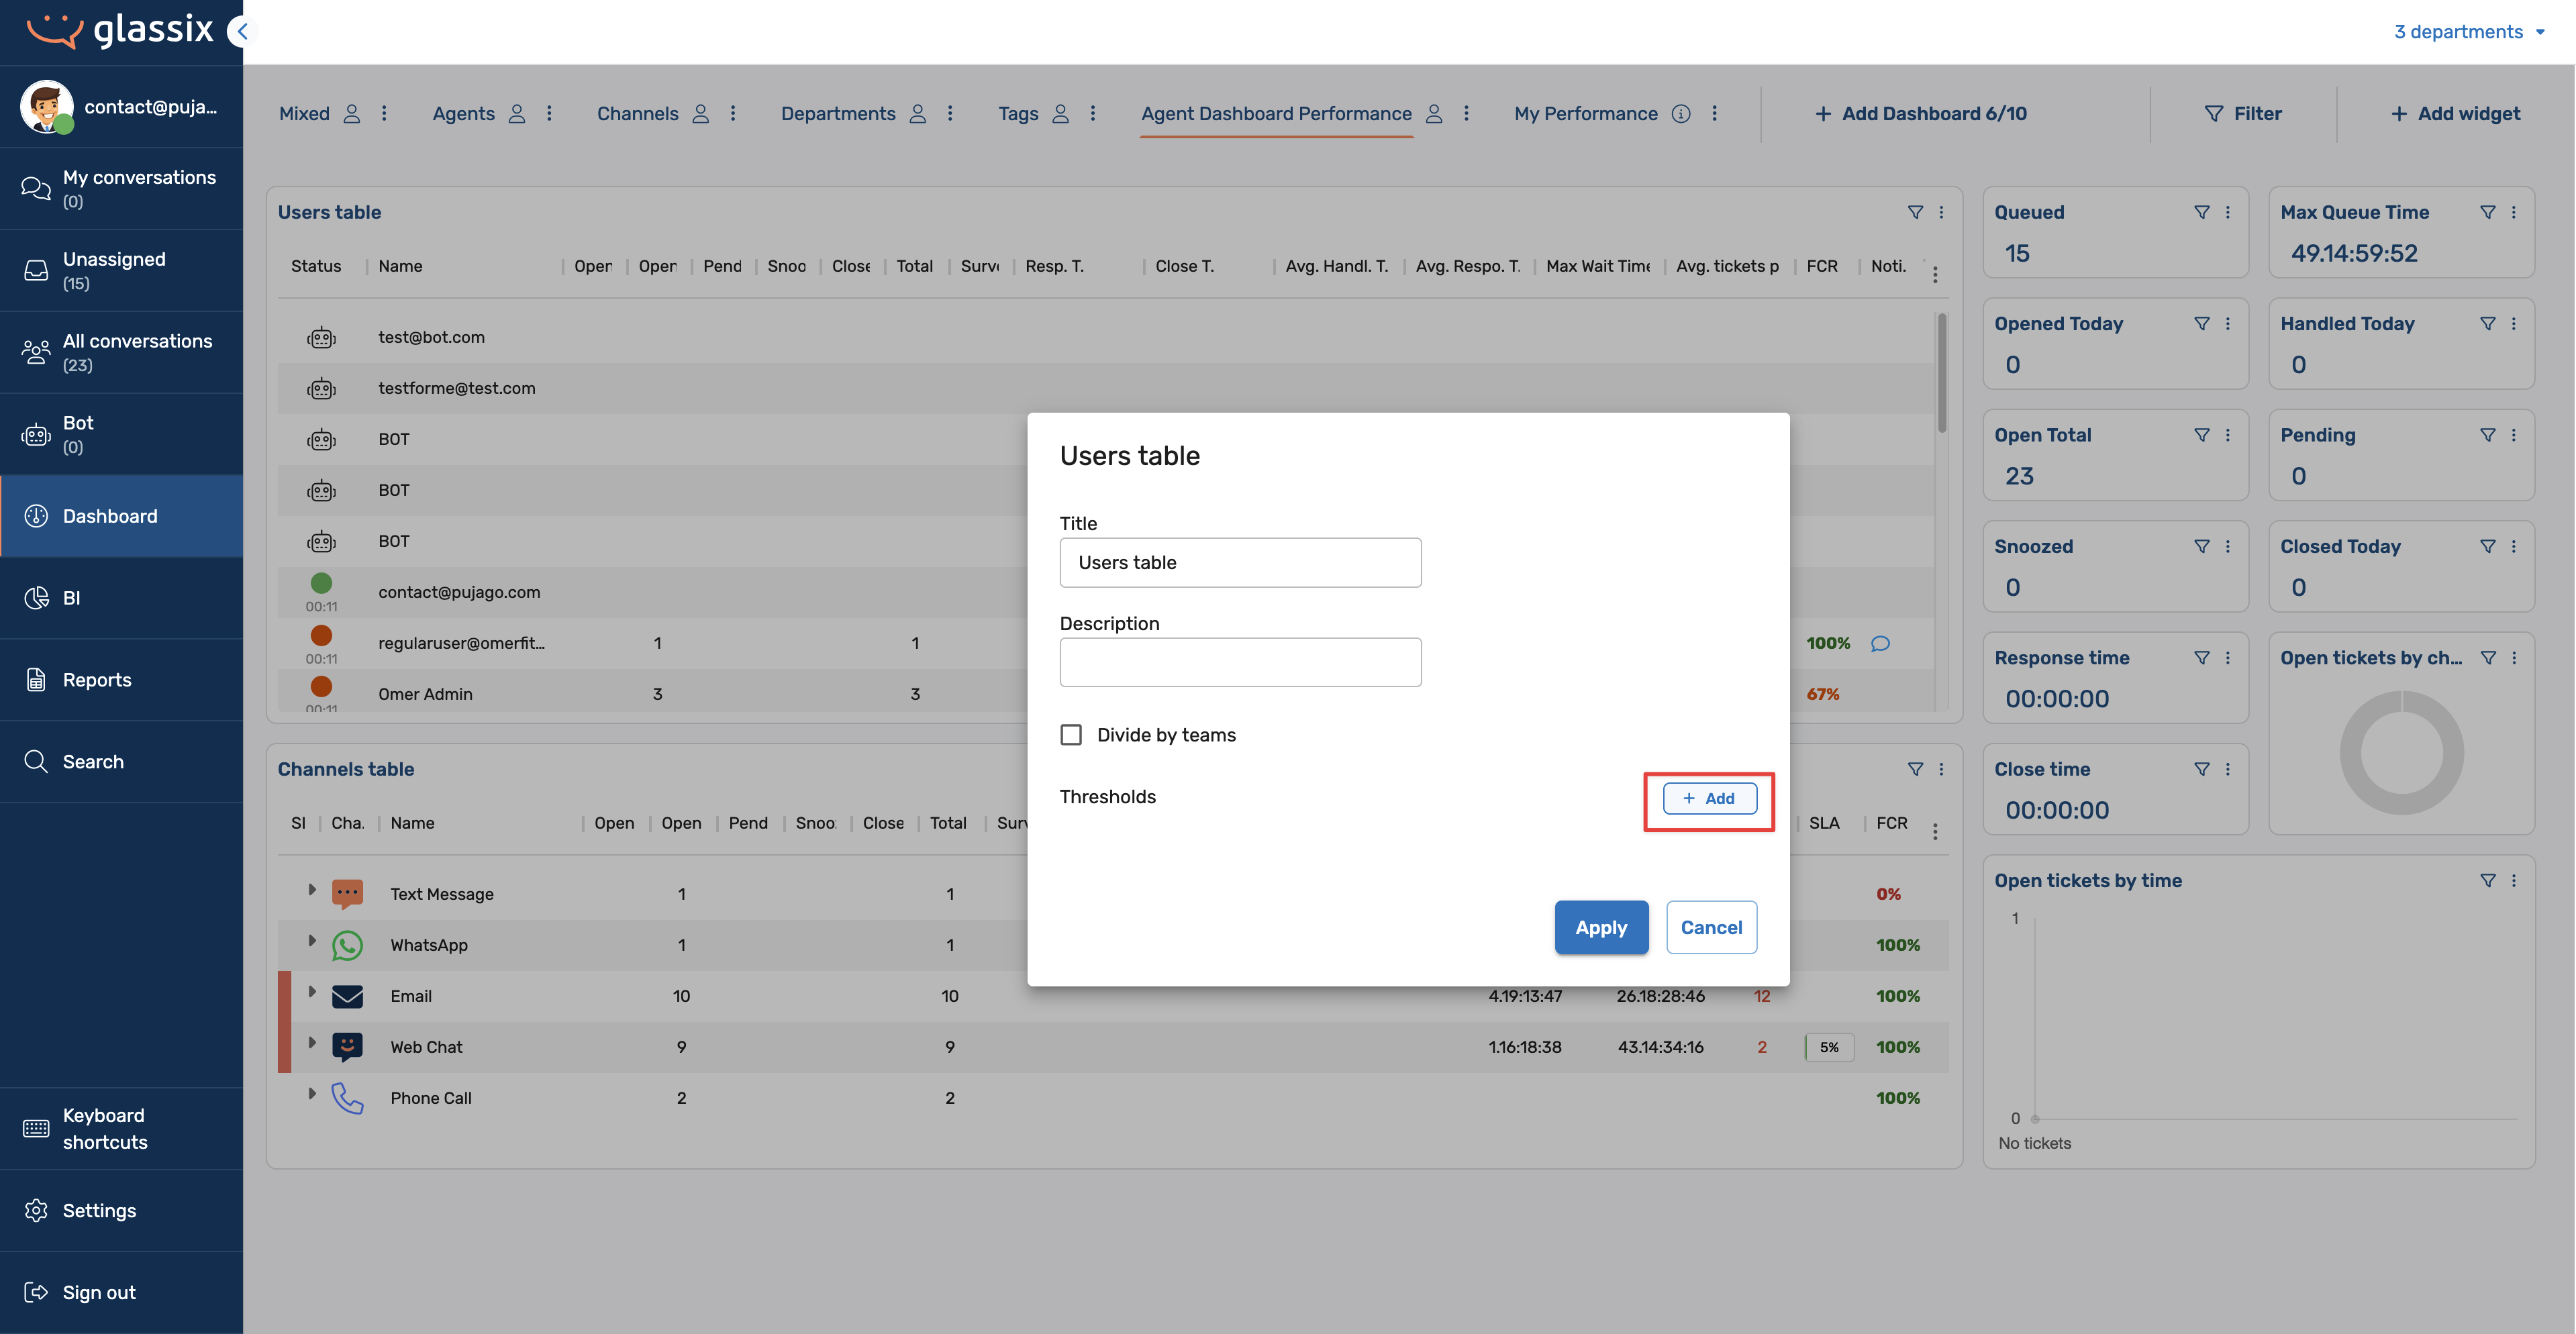
Tables support thresholds per statistic. For example: Users table
-
To add thresholds to tables, click the three-dot menu and select Edit.
-
Click Add to enter threshold values. Decide in advance how many thresholds you want to set up, and click the Add button that many times.
-
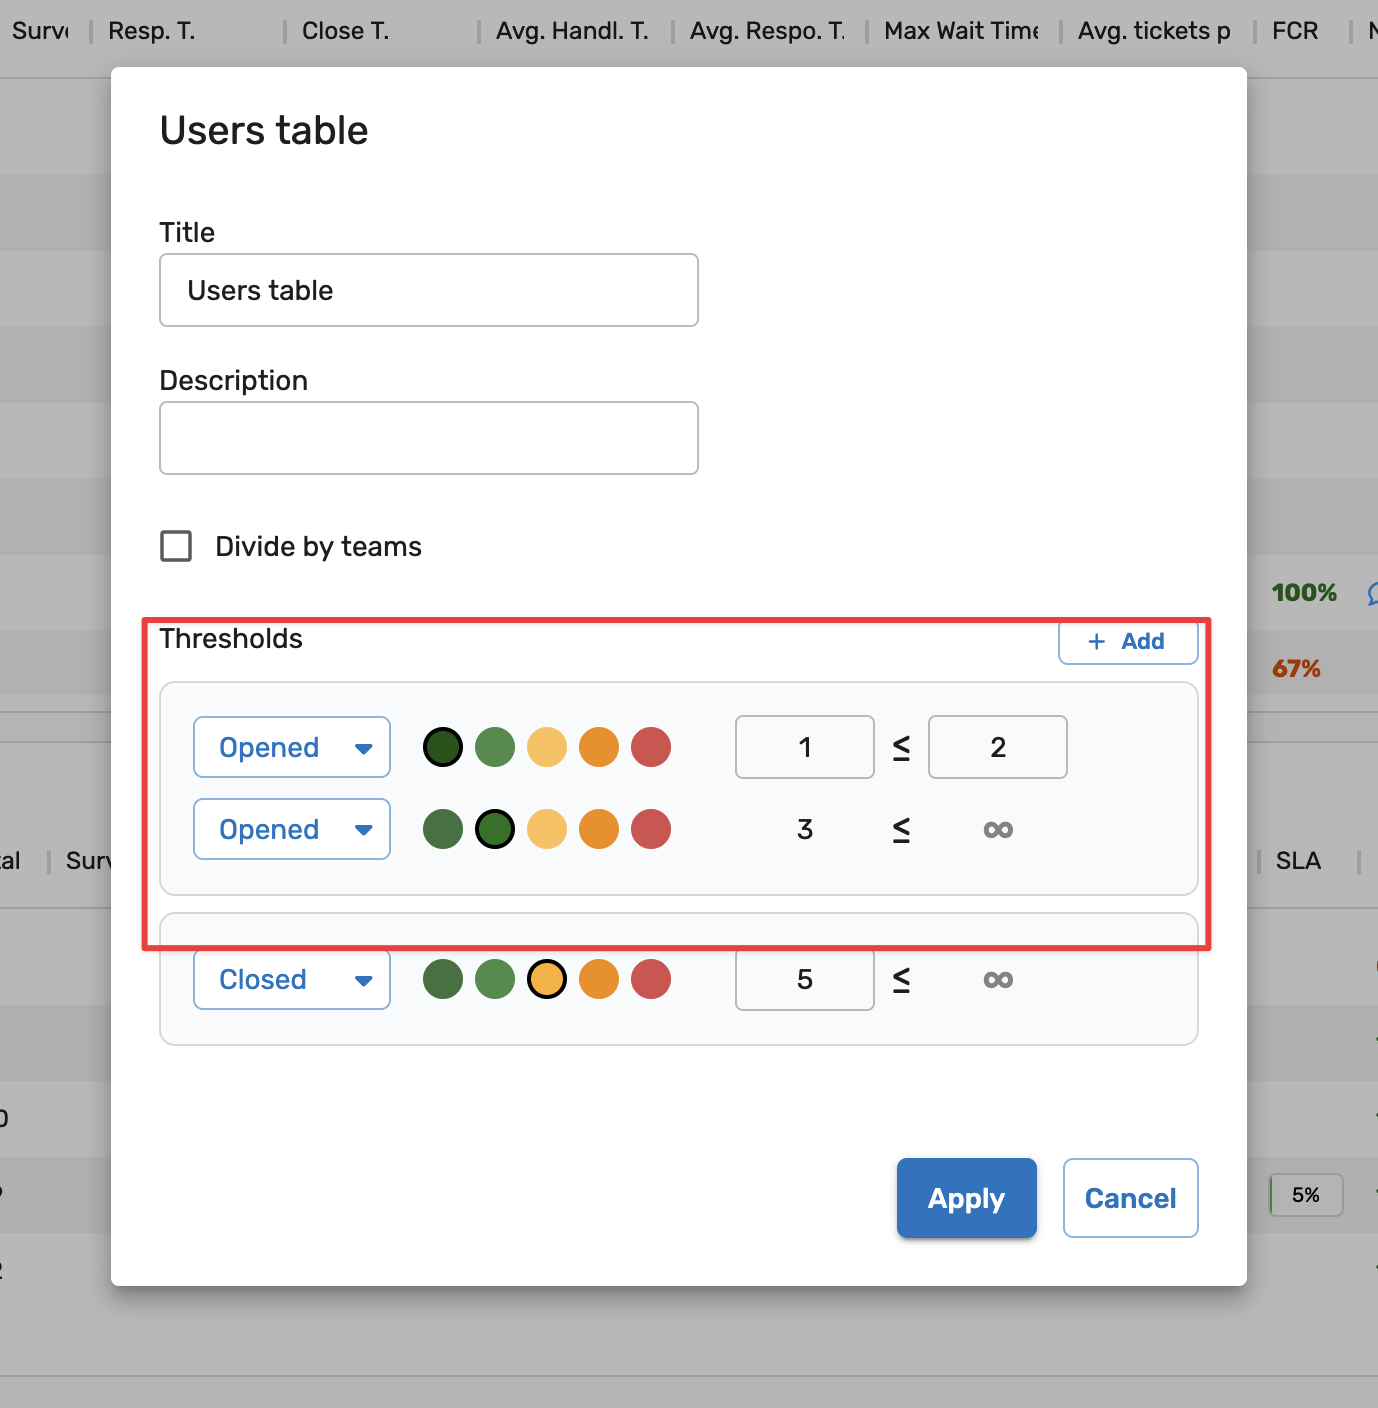
Configure the threshold values based on the statistics and assign color codes. For example, if you want to set up three levels of threshold for a table, then configure them as follows:
-
0–5 pending tickets → Green
-
6–10 pending tickets → Orange
-
11+ pending tickets → Red
-
When you change which statistic a threshold applies to in a table, it automatically creates a separate threshold group. This allows different columns in the same table to use different visual rules.
Adding Thresholds to Tiles
Tiles support thresholds at the tile level. For example: Total queued tickets. To add thresholds to tiles, follow steps similar to those for tables.
Applying Filters
Filters help you refine the data displayed by tag, team, department, and more (consistent with the filters throughout the product).
- Tile-level filters (accessed via the filter icon on a widget) affect only that widget.
- Dashboard-level filters (located in the dashboard header) affect all widgets on the dashboard.
Adding a Custom iFrame Widget
In addition to pre-built widgets, you can add a custom iFrame widget. This allows you to embed external data, such as Salesforce metrics or those from another system, directly into the dashboard.
To add a custom iFrame, navigate to Add Widget-> Other and choose the iFrame widget.
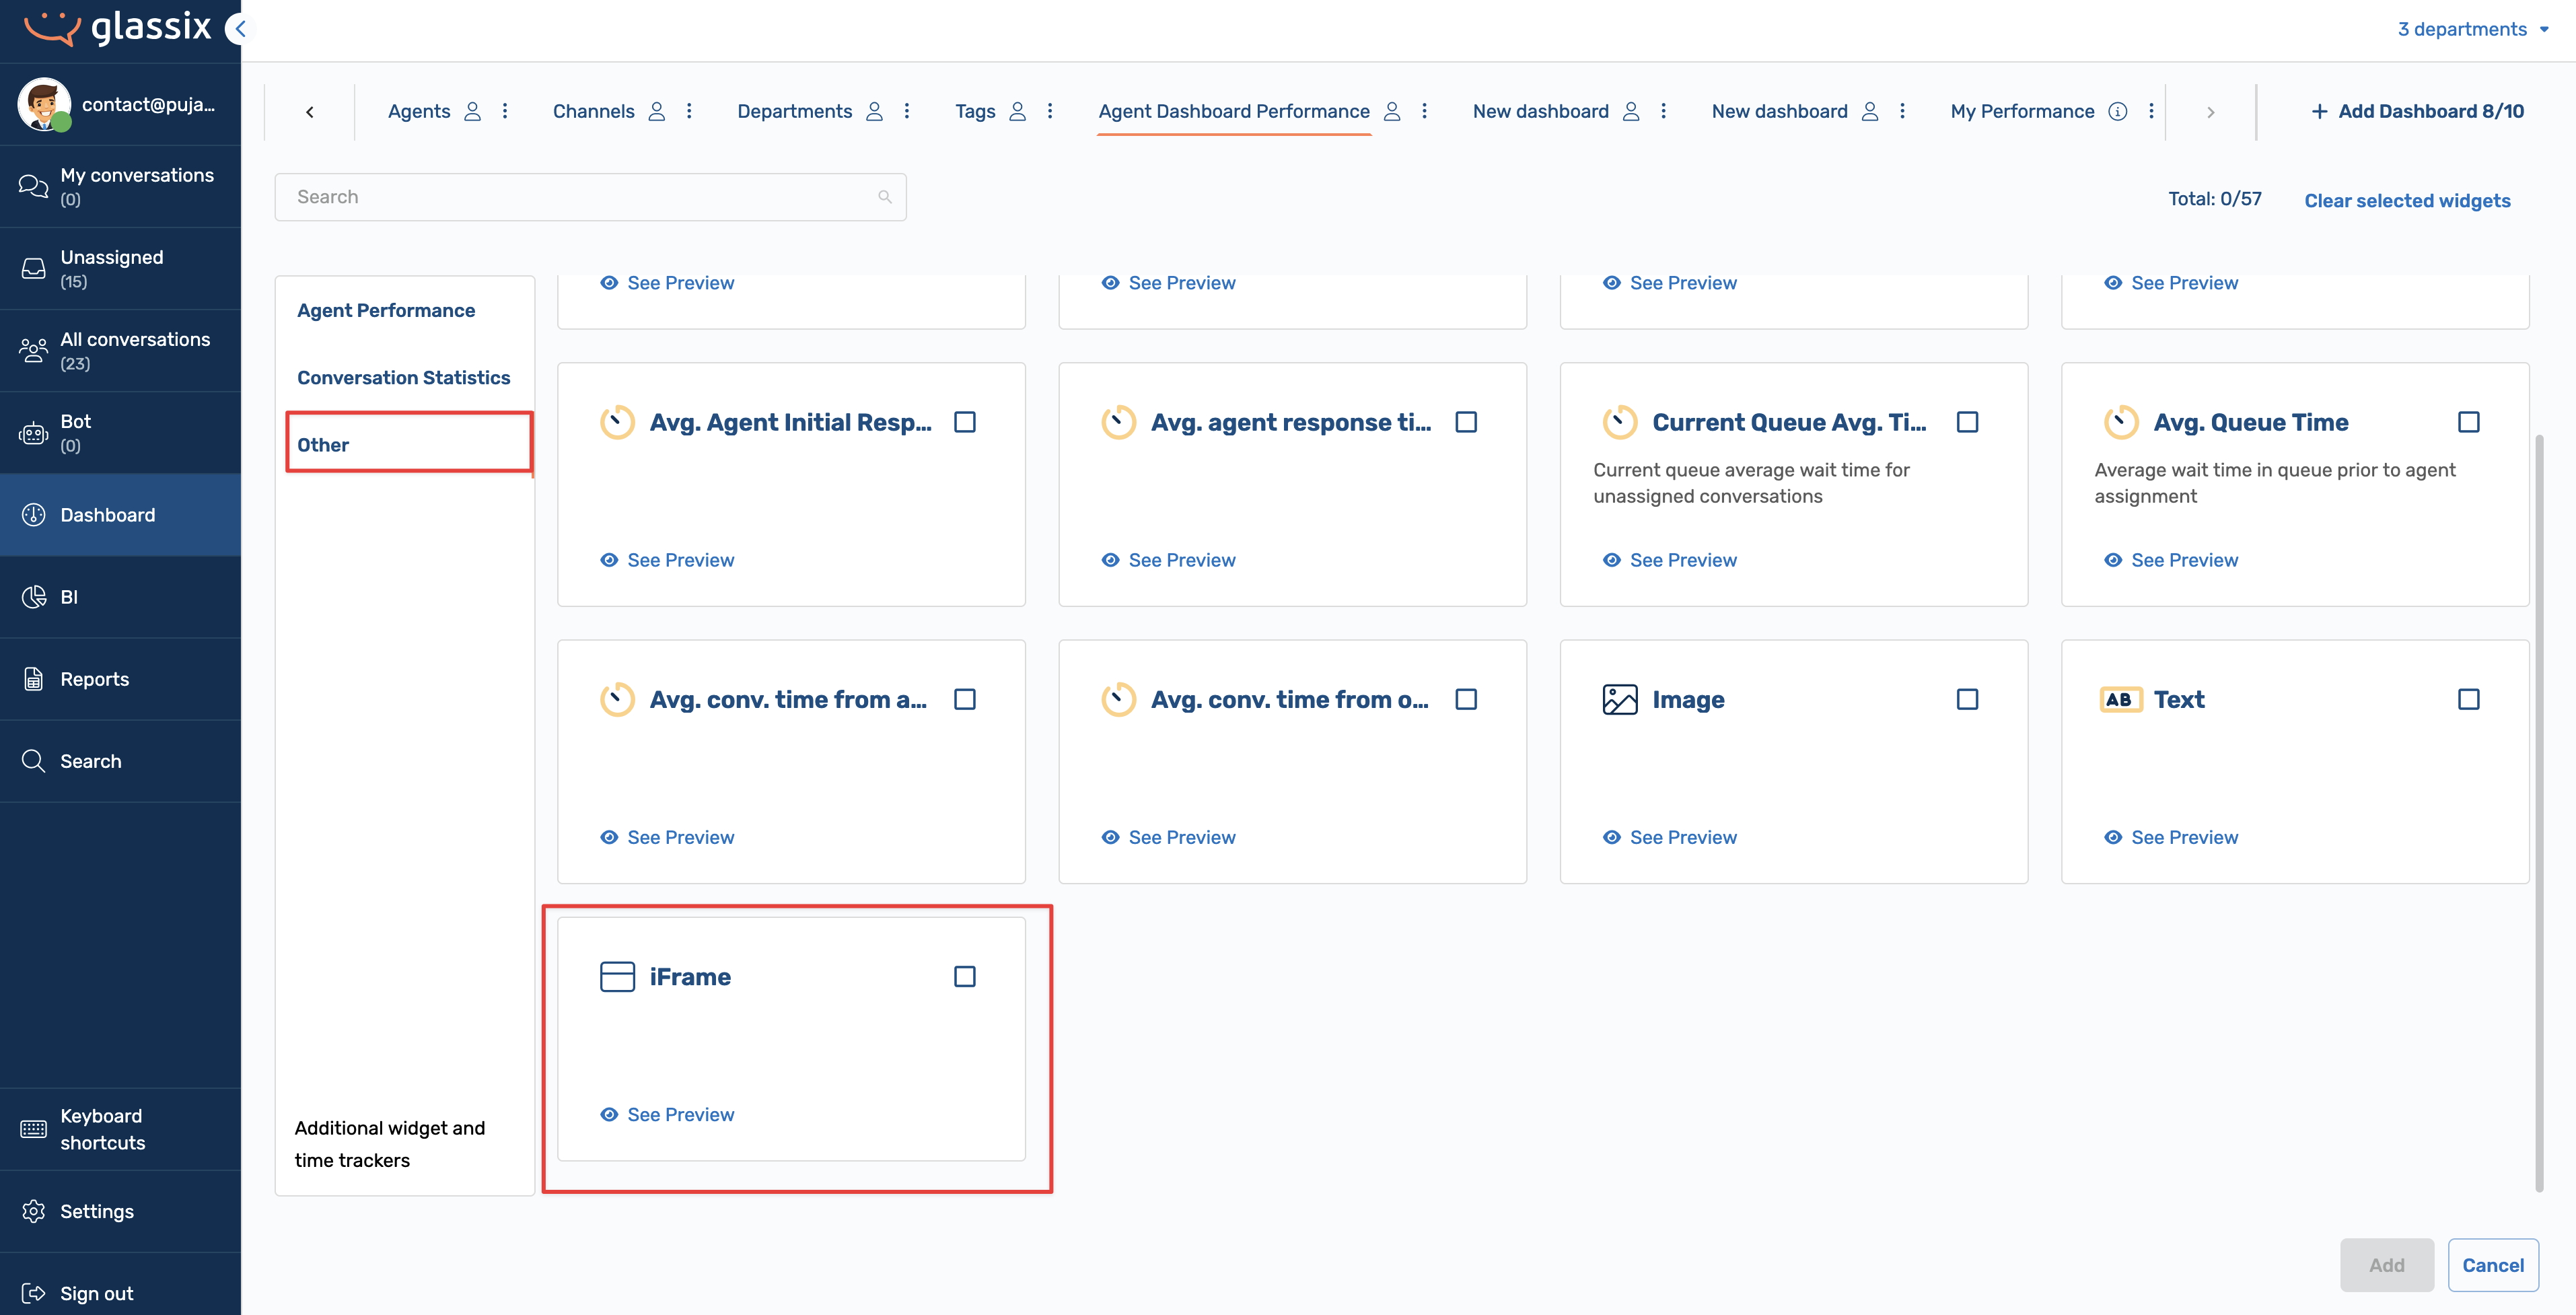
A few things to note:
- The iFrame requires a secure URL and proper authentication.
- Data is one-way only; there is no two-way communication with the dashboard.
- This option is most useful if you already have an external integration in place.
Finalize Dashboard Settings
Once your layout, widgets, thresholds, and filters are set:
- Open the three-dot menu in the dashboard header.
- From here, you can:
- Rename the dashboard.
- Duplicate it to create variations for other teams.
- Set access (public or private).
- Make the dashboard read-only if needed.
- Share the dashboard across teams.
- Delete dashboards.
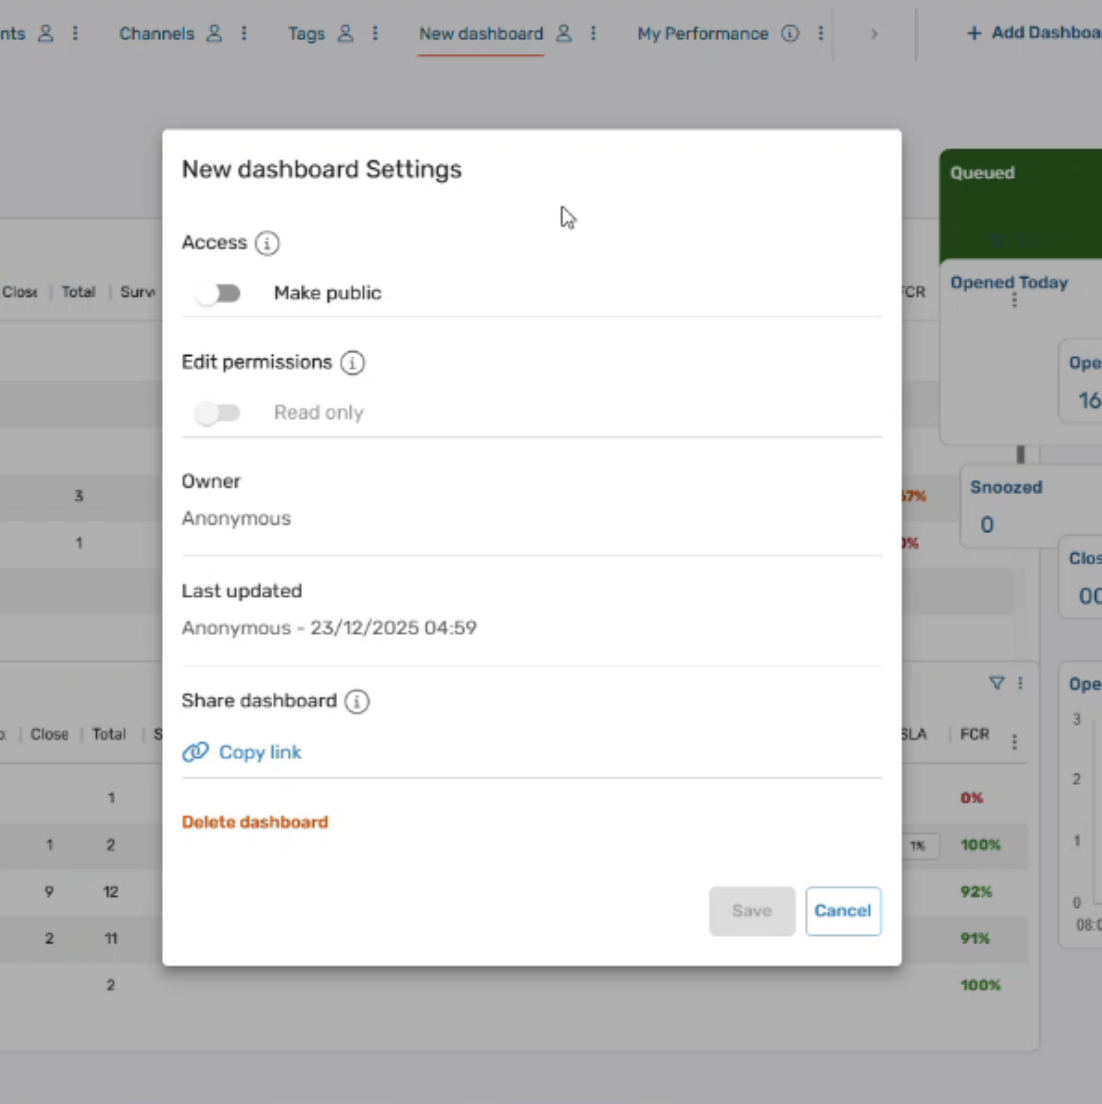
These settings help you reuse dashboards efficiently across different teams or use cases.
Save Your Dashboard
After finishing all changes, save the dashboard settings. If you exit without saving, all edits will be lost. Saving is the final and most crucial step.
Best Practices
- Design dashboards to fit on a single screen whenever possible.
- Use color thresholds to instantly communicate status.
- Limit tables to one per dashboard for clarity.
- Create multiple dashboards rather than overloading a single one (you can have up to 10 dashboards).
A well-designed dashboard should tell you, at a glance, whether your team is in a good state or if action is needed immediately.
Updated 3 months ago